Energy Policy 101: How the Movement of Electrons is Regulated


Energy policy development is complicated. Recall that the electric industry has been regulated for more than 100 years and it remains highly regulated today, even with competitive markets. Moreover, both the Federal government and States have roles to play in regulation. Using examples, this article focuses on federal jurisdiction over “wholesale” electricity that flows across state lines and is not sold for direct consumption to end users. Sales to end users, including authorization of competitive retail suppliers, is the exclusive jurisdiction of the states.
In the U.S., policy at the highest level is established by Acts of Congress and the President. It is implemented by the executive branch including the Federal Energy Regulatory Commission (FERC) and the Department of Energy (DoE). This policy establishes a framework for the tariffs that govern the use of the nation’s electric transmission grid. It is useful to think of this framework as a “top down” process. The owners and operators of the transmission grid, in turn, submit tariffs that comply with the law and policy to FERC for approval. The development of tariffs is a “bottom up” process.
Three examples of the biggest orders to come out of FERC during President Obama’s administration include FERC Order 745, which required ISOs and RTOs to pay customer-side capacity resources such as demand response an equivalent value to what power plants and other supply-side resources earn; FERC Order 755, which required ISOs to create programs to reward “fast-responding” resources such as batteries for frequency regulation; and FERC Order 1000, which has set up a new regime for transmission operators and utilities to plan for, and pay for, regional grid investments.
The FERC has been instrumental in creating Regional Transmission Operators (RTOs) through policy decisions. RTOs and Independent System Operators (ISOs) have largely eliminated the need to set wholesale electricity prices by a fixed tariff and instead allow prices to be established by markets. The detailed implementation of electric policy is done at the RTO level. FERC’s decisions and orders apply to the tariffs of ISOs and RTOs that run much of the U.S. power grid. About 70 percent of the country is served by ISOs and RTOs, which fall under federal jurisdiction because they cross state lines.
The shift to RTOs has not eliminated the need for regulation of electricity. Instead it has shifted the regulatory focus from setting prices to setting market rules. The market rules are embodied in the RTO tariffs. The FERC is responsible for approving the RTO tariffs. The RTO tariffs are developed with varying degrees of stakeholder input, depending on the RTO itself. The basic process follows the steps from stakeholder consideration to RTO and final review and approval by FERC using stakeholder input as shown below:

Each RTO handles stakeholder consideration differently. PJM Interconnection, for example, is the only RTO that is required to accept stakeholder recommendations as determined by a vote – at least on some issues. Other RTOs simply consider the input of stakeholders and file what they think best. There is little doubt that PJM has the most robust process. Most issues are addressed through a series of meetings that follow a set process. The process is not unlike a government legislative body with committees, subcommittees, etc. Often stakeholders reach consensus and many issues are resolved with no or nominal opposition.
Demand Response Policy Considerations
Perhaps one major exception to consensus pertains to issues involving capacity market design, including Demand Response (DR) participation. On these issues, stakeholders are typically split between generation owners – including incumbent utilities – and load interests. This is because any changes that reduce the opportunity for generation participation or revenue leads to reduced income for generators. Such changes include enabling competitive resources such as DR and reductions in overall capacity requirements.
Conversely, stakeholders representing users of electricity oppose changes that increase costs without a credible probability of improving reliability. As a result, most controversial issues have competing proposals. Stakeholder votes are allocated in such a way that a required two-thirds’ supermajority (this applies to PJM) for approval of contested changes is difficult to reach. A deadlocked stakeholder process allows PJM to file changes that may not have broad stakeholder support. RTOs are non-profit entities without a commercial stake in market outcomes. However, as organizations, PJM and other RTOs have an inherent bias toward “reliability” which often results in costly requirements for more resources, especially conventional generation.
Stakeholders that oppose an RTO filing have the opportunity to “protest” the tariff changes at FERC. FERC need only determine that a filing is “just and reasonable”. While ostensibly the “just and reasonable” standard may include cost considerations, FERC, like PJM and other RTOs, also has a bias toward reliability and often will accept the RTO filing regardless of cost implications.
FERC Decisions and the Appeals Process
FERC decisions can be appealed to the federal courts on the basis non-compliance with the governing law, or an “arbitrary and capricious” decision. Appeals Courts avoid ruling on the substance of a FERC ruling because this can place the Court in the position of creating laws and regulations. Appeals Court decisions can be appealed to the Supreme Court as occurred in the high-profile case of FERC Order 745. In particular, owners of conventional generation (the petitioners) opposed the Order because the treatment of demand response threatened their revenues and they took FERC to court. The case hinged primarily on the issue of state versus federal jurisdiction (was the Order consistent with the Federal Power Act’s provisions designating retail rate setting as the exclusive jurisdiction of the states?).
In a major victory for the DR industry, the U.S. Supreme Court upheld FERC Order 745 via a 6-2 decision in January 2016, reversing a lower court opinion that found that it violated states’ jurisdiction over retail energy pricing, and dealing a blow to the utility group that brought the original lawsuit. DR providers and environmental groups supported FERC Order 745, noting that it has opened markets that have brought significant new demand-side capacity to the country’s grid operators for use in controlling the wholesale grid. Order 745 also helped reduce the need for fossil fuel-fired power and lowered overall electricity costs for consumers. But the underlying legal question behind the lawsuit — the bounds between federal and state jurisdiction over energy markets — could be modified by Acts of Congress.
You can see why the process of defining energy policy can be extremely complicated in practice. CPower takes a leadership role in shaping market transformation and regulatory reform, while working hard to maximize program benefits for our customers. It’s imperative that our Market Development team constantly stays abreast about regulatory processes as thought leaders in the DR community. These efforts enable us to provide services that take the complexity out of DR participation within the context of changing program rules, while optimizing your energy savings and earnings. This will become increasingly critical as energy markets continue to transform in the near future.
Hot Summer Ends Without Emergency Demand Response Events in PJM


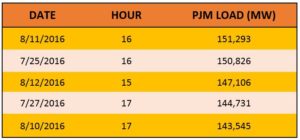
The 2016 PJM summer compliance season which runs from June through September has come to an end without a PJM-initiated emergency demand response (DR) event. The first six months of the year were already one of the warmest on record. So, for many of us sweating it out across the northeast, it was no surprise that this summer produced several heat waves that pushed system peaks to their highest levels in recent years. PJM’s top 5 system peaks (see table), reflect the summer’s weather and should be the Five Coincidental Peaks (5CP) that drive customers’ capacity charges through their Peak Load Contribution (PLC). It is important to note that any load reductions during these hours may reduce your capacity charges for next summer.
When it came to actual demand response events, however, a different picture unfolded compared to prior years. For instance, the 2013 summer saw system peaks at similar levels and was one of the most active summers for demand response customers ever. So you may ask: Why were no Emergency DR events called this summer, despite the heat and high system peaks? A few reasons come to mind:
- Some of it may be attributed to PJM’s new reliability product, Capacity Performance (CP), which debuted this delivery year and imposes greater availability requirements on generation;
- Some of it may be attributed to increased transmission efficiency;
- Also, flat or declining system peaks are starting to reflect the impact of energy efficiency regulations (the last system peak demand record was set in 2007); and finally
- Pure Luck? After all, the timing of several heat waves passing through the PJM territory coincided during weekends.
Whatever the primary reason(s), PJM Emergency DR customers should take pride in their commitment to be on standby to reduce load when called upon. Your ability to curtail electricity consumption when needed by the grid is a tremendous asset to maintaining system reliability and preventing potential blackouts/brownouts.
This doesn’t mean that PJM may not have a reliability issue beyond the summer as the program year does run through May 2017. Also, while the summer period yields the greatest risk of an emergency event, demand response customers that have committed to curtailments all year should continue to be prepared to perform and reduce load if/when needed to support grid reliability.
Moreover, with the transition to the new CP product, demand response is morphing into a year-round program. Customers can start participating in CP now to get themselves prepared for the coming changes and earn additional capacity revenue in the process. Many forward-thinking facility managers are already thinking about how they may be able to participate beyond the summer and are reviewing effective winter curtailment strategies.
CPower would like to take this time to thank all demand response customers for their commitment to PJM reliability this summer. CPower customers can always review their load drop test and event performance in the CPower App and should be expecting summer performance reports and payments starting early November.
Last but not least, we always encourage all participants to stay tuned for earnings opportunities in other DR programs available. Many participants augment their demand response earnings from the capacity program via active participation in PJM’s voluntary programs such as (price based) economic demand response and (faster response) ancillary services such as synchronized reserves.
Please feel free to contact Dann or the CPower team if you have any questions. Our engineering team is happy to help you understand the nuances of participating in these programs and assist in optimizing your overall energy savings and earnings year round.
Buildings Evolve. Your Building Management System Should, too.


In 1992, I co-authored a chapter for the second edition of the Energy Management Handbook titled “Energy Management Control Systems.” In it I described, among other ideas and practices, the importance of software to facilitate the ongoing success of an efficient energy management control system (EMCS).
We’ve seen a host of innovation in the energy industry during the 25 years since I originally published this chapter, but the principles I introduced remain sound.
Today the combination of automated building controls and up-to-date software can lead to an organization earning significant revenue through demand response participation. The key to optimizing demand response and maximizing your earnings comes down to maintaining your building management system so it can become an efficient tool for demand response.
Building usage and programming logic should evolve in lockstep.
Commercial building usage and environments continuously change throughout their lifetime. Activities, processes, schedules, space configuration and populations vary from time to time. When Building Management Systems (BMS) are first installed, the software programing logic (i.e. control sequencing, set points, etc.) is configured for building usage at that time.
It is essential that programming logic be kept current with any changes in a building’s use and environment. Failure to do so can result in control sequences and set points being over ridden, which negates the benefits envisioned by the intended energy management strategies.
Certain components of a building management system require regular maintenance.
Occupancy schedules need to be managed on a day-to-day basis at buildings that have sporadic after-hours occupancy, i.e. schedule a specific zone to be occupied for specific hours on a specific day. HVAC control sequences, set points, and zonal environmental control need to be periodically adjusted to adapt to changing usage and conditions.
Crucial components are often overlooked.
BMS maintenance agreements are a discretionary cost. These agreements typically focus on system hardware, which is perceived to be more impactful on the budget than software maintenance.
However, inefficient energy management can have a significantly greater impact on the budget. Vendors provide training for in-house staff on minimal software maintenance, such as—for example—changing set points and scheduling after-hours events, during initial installation.
This maintenance feature disappears when trained staff move on; however, changes to control sequencing require the use of vendor software engineers which require additional expenditures. Building staff are alert to hardware maintenance needs but tend not to recognize when software maintenance is needed.
A well-maintained building management system is advantageous for optimized demand response.
Demand response can be implemented with minimal disruption to building environmental conditions and usage when BMS programming logic is maintained current, whereas building conditions and usage in a building with a poorly maintained system can become uncomfortable causing disruption to building activity when responding to demand response events.
Demand response payments provide a source of funding for incorporating demand response sequencing and software maintenance in the BMS vendor’s ongoing maintenance agreement. CPower can advise on demand response control logic specific to each ISO.
Maintaining BMS software current not only ensures energy savings intended when the system was first installed but also provides a solid platform to reap substantial energy cost offsets afforded by participating in demand response. CPower can work with building managers to optimize the financial benefits that can accrue from participating in demand response by interfacing with the BMS to automate demand response event action and enhance performance with minimal impact on building environment.
Contact us and to find out if your building’s BMS is in need of an update, or to learn how you can earn revenue with demand response optimized through optimization.
What the Worst Gas Leak in US History Means for Demand Response in California this Summer


Demand response participants will play an essential role in keeping Southern California’s energy grid stable this summer. Here are a few reasons why and a few insights on how DR customers can position themselves for a successful season.
The leak at Aliso Canyon has consequences for energy supply in California.
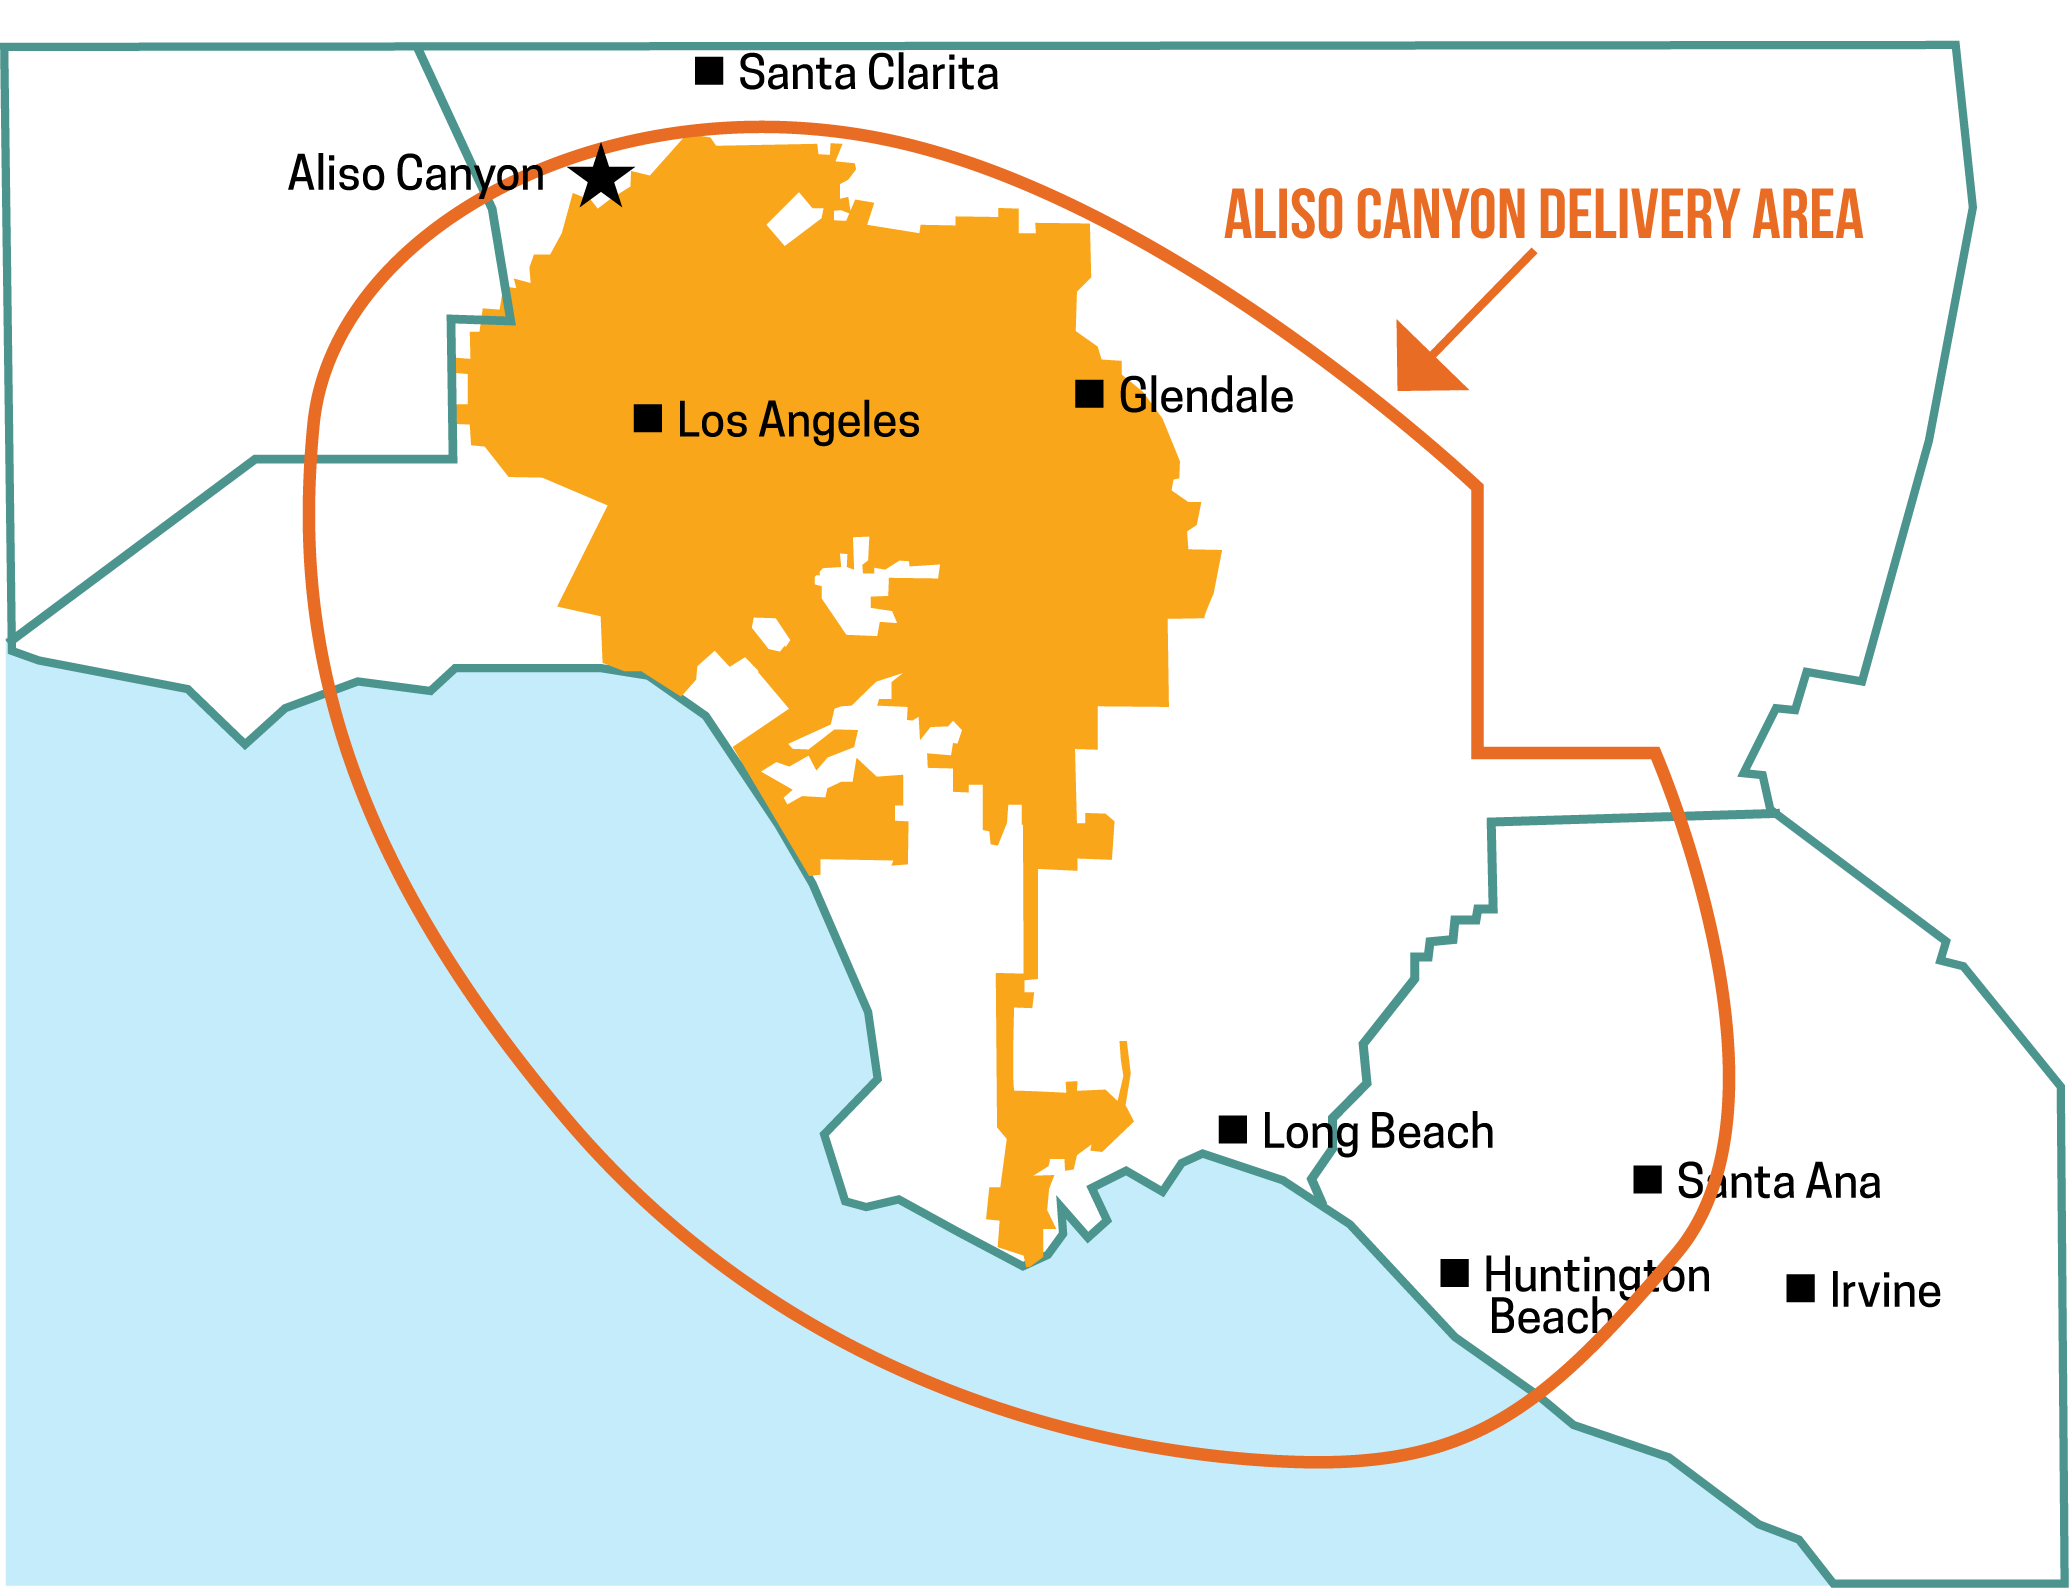
In October 2015, Aliso Canyon— the largest natural gas storage facility in California—suffered a leak in the LA Basin/Porter Ranch area, resulting in the emission of more than 97,000 metric tons of methane. To put the tonnage in perspective, the leak produced enough methane gas each day to fill a balloon the size of the Rose Bowl. The leak was plugged after 112 days.
The fallout has proven costly for the natural gas infrastructure in Southern California. According to the “Aliso Canyon Risk Assessment Technical Report,” the leak reduced Aliso Canyon’s gas stores to less than 20% of its capacity.
Low capacity means high risk for blackouts this summer.
The drop in capacity could cause trouble for the 17 natural gas generators served by the Aliso Canyon facility if (and when) electric demand is high this summer. The Assessment Report also warns that millions of California customers may suffer an interruption in electrical service during as many as 14 days this summer when demand is expected to be at its highest.
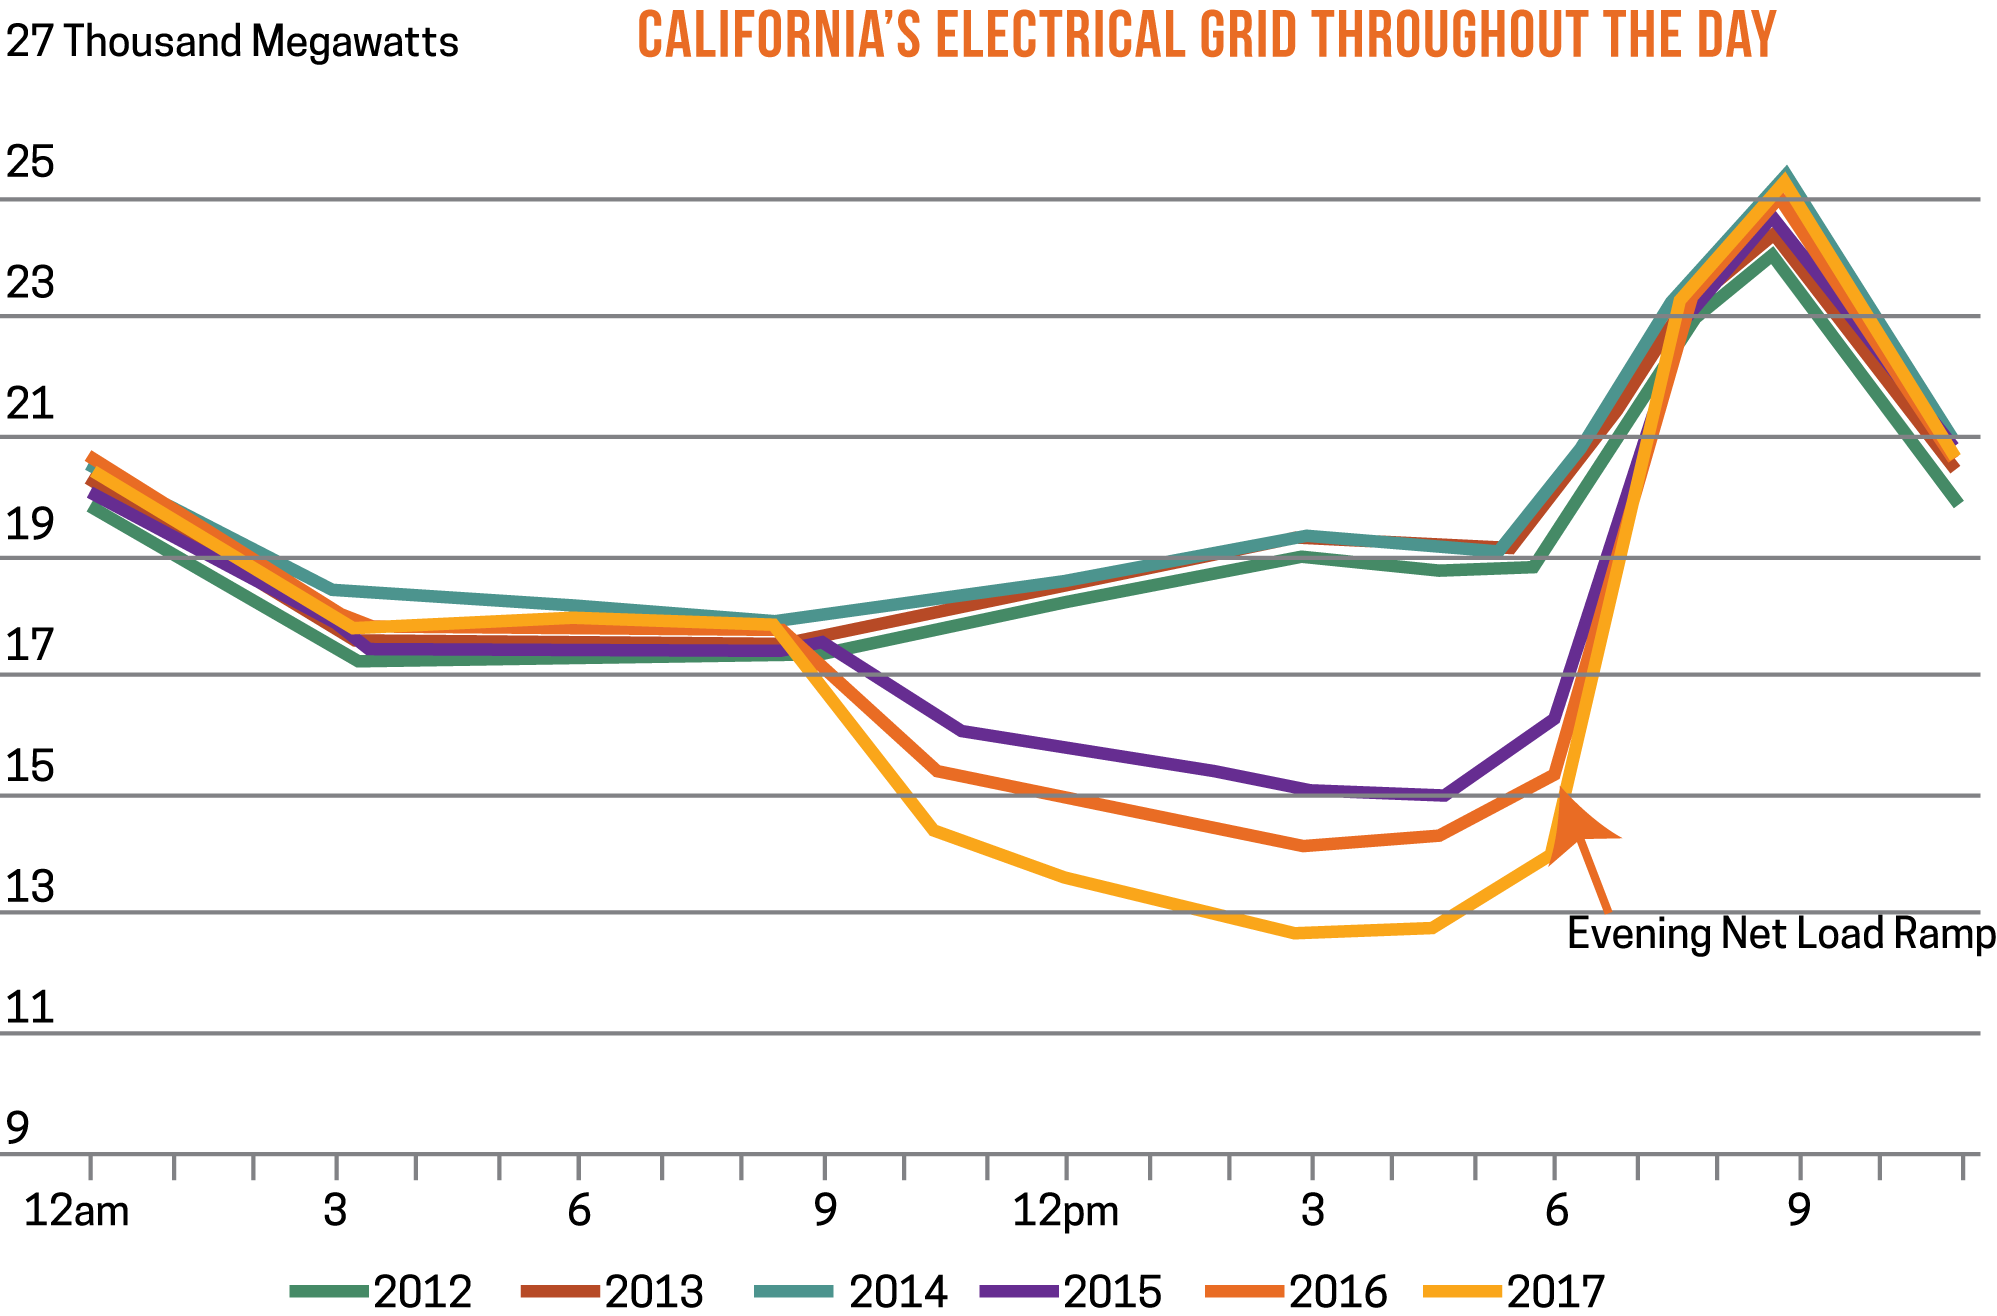
The grid will be at its most fragile in the evenings when the sun sets, causing a drop in available solar resources. The drop in solar coincides with a spike in demand as people come home from work and flip on their air conditioning.
Demand Response will help grid reliability.
The joint agencies that produced Aliso Canyon Assessment Report have also drafted an Aliso Canyon Action Plan that calls for, among other mitigation strategies, demand response to help keep the grid stable in the LA Basin this summer.
California’s Base Interruptible Programs (BIP), in which participants provide load reduction on a day-of basis in Southern California Edison’s (SCE) and Pacific Gas and Electric’s (PG&E) service territory, allows for fast dispatching of emergency resources and is therefore expected to be heavily utilized to alleviate grid stress in Southern California this summer
How energy prices may trigger key curtailment programs:
Summer electricity prices may climb high enough to trigger SCE’s Aggregator Managed Portfolio (AMP) program, as well as statewide Demand Response Auction Mechanism (DRAM) programs, which aim to offset grid stress and avoid potential blackouts by reducing load via demand response.
Due to the high amounts of solar and other renewable generation available in California during the call hours of these programs, overall energy prices are not as tightly correlated with natural gas as they can be in other states.
The gas shortage caused by the leak at Aliso Canyon will drive heat rate levels in the LA Basin. This will cause natural gas heat rate triggered programs like CAISO’s Capacity Bidding Program (CBP) in PG&E to have a potentially higher instance of calls this summer.
Preparation is the key to successful demand response.
This summer, more so than in previous seasons, demand response will be a crucial component of grid reliability! When the grid sends out its distress notice, time will be of the essence to avoid blackouts. Make sure your curtailment plans are in place and your curtailment personnel are at the ready.
CPower can help answer any questions you may have to help you prepare for the summer season. Click HERE to contact our California team.
The City of Danville Finds Success with Demand Response and CPower

AMP Member passes ordinance, increases revenues through energy reduction
Hardworking businesses form the backbone of the City of Danville, Virginia. When it comes to overseeing the energy needed to run the city’s economic engine, Danville Utilities—the City of Danville’s electrical department—understands the need to maintain the balance between consumption and conservation.
“As a municipal utility, we are always encouraging our customers to find ways to save energy,” says Meagan Baker, Danville Utilities’ Key Accounts Manager. The City of Danville — an AMP member municipality — perpetually seeks ways that not only allow their customers to conserve energy, but also allow the utility to save on congestion and transmission charges during the most critical peak times of the year.
Enter demand response and, what the City of Danville calls, “a win-win situation for the utility and the customer.”
In early 2014, the City of Danville adopted a resolution authoring their participation in the PJM demand response program for retail customers. The resolution allowed Danville’s city manager to execute an agreement with American Municipal Power approving the city’s participation in PJM’s demand response programs, which pay businesses for reducing their energy use during the few times each year when the PJM grid is stressed.
The agreement also named CPower as the City of Danville’s exclusive PJM curtailment service provider in charge of implementing and facilitating the city’s demand response. Danville Utilities believes their customers couldn’t be in more capable hands.
“CPower has been a great source for implementing our demand response program. Bill Oosterom, our account manager, has been our go-to person from start to finish. From educating customers about the program, getting them enrolled and assisting with any questions and/or concerns they have along the way, the process has been very transparent and straightforward. This streamlined approach makes it easier for our customers as well.” – Meagan Baker Key Accounts Manager, City of Danville
The City of Danville Finds Success with Demand Response and CPower
CPower’s hands-on style of energy management includes the kind of customer-focused touch the business owners of Danville appreciate. CPower’s Bill Oosterom believes that being personally involved in his customers’ demand response participation is a key reason the City of Danville has enjoyed energy management success.
“No two businesses are alike,” says Mr. Oosterom, who has more than 33 years of experience as an energy consultant. “Demand response shouldn’t be a set-it-and-forget-it process. At CPower, we work closely with all our customers to fine tune their demand response participation over time and ensure they get the maximized results and revenue they deserve.”
So far, the results from the City of Danville’s demand response participation have proven to be substantial. Participating customers have earned significant revenue through demand response (more than $97,000 in aggregate for the 2015-2016 program years), with many businesses choosing to put their earnings toward energy efficient upgrades or other capital improvement projects.
Even the City of Danville, itself, has participated in demand response with great success. Facing a need to offset operational costs, the City of Danville enrolled its municipal-owned water and wastewater treatment plants in the program and have now earned valuable revenue (more than $30,000 for the 2015/2016 program) to help budgets of future projects. Civic leaders feel the City of Danville’s involvement in demand response provides a lead-by-example model of energy management. “We are always asking our customers to conserve,” says Meagan Baker, “so we must practice what we preach.”
For the City of Danville, the future looks bright as the number of businesses in their municipality participating in demand response is on the rise. With CPower and demand response on their side, the City of Danville is poised to do their part to keep the grid in balance, the environment in good health, and their hardworking customers in expert hands when it comes to energy management.
“The program has been very beneficial in educating our customer base on the importance of energy efficiency and demand response. As our customers continue to succeed, I believe the word will spread, positively influencing other customers to also become involved. We are excited to grow the program.” — Meagan Baker
AMP urges you to pass your local demand response ordinance as quickly as possible, to ensure that there is ample time for program participants to be registered for the 2017-2018 program year.