Why U.S. Energy Expenditure Share is the Metric Your Organization Needs to Understand

Uncertainty is the arch-nemesis of business. In planning for 2020, it appears our old foe has the upper hand
Is 2020 a year for your organization to get aggressive and try to expand? Or is it a year to sit tight and see what happens? Maybe it’s time to pull back on the reins.
Chances are, regardless of your organization’s particular industry, the last two and a half to three years have been especially strong from a growth and productivity standpoint.
After all, 2019 marks the tenth straight year of growth for the U.S. economy, and the U.S. GDP has especially boomed since 2016.
So why, then, is planning for 2020 proving to be harder than in previous years?
The short answer: uncertainty. And this year, our old nemesis is back with a vengeance and flanked by his favorite minions: speculation and conjecture.
No one knows for certain what the future holds. No one knows for sure how long the trade tariffs will last. No one knows who’s going to win the 2020 Presidential election. And no one knows for certain where energy prices might be at this time next year.
And yet here we are, looking for any credible insight we can find that will bring the future into focus so we can make the business decisions today that will position us for success tomorrow.
Rather than guess what tomorrow’s landscape might look like, let us instead look at one key fact established by what already has happened to energy in the U.S.

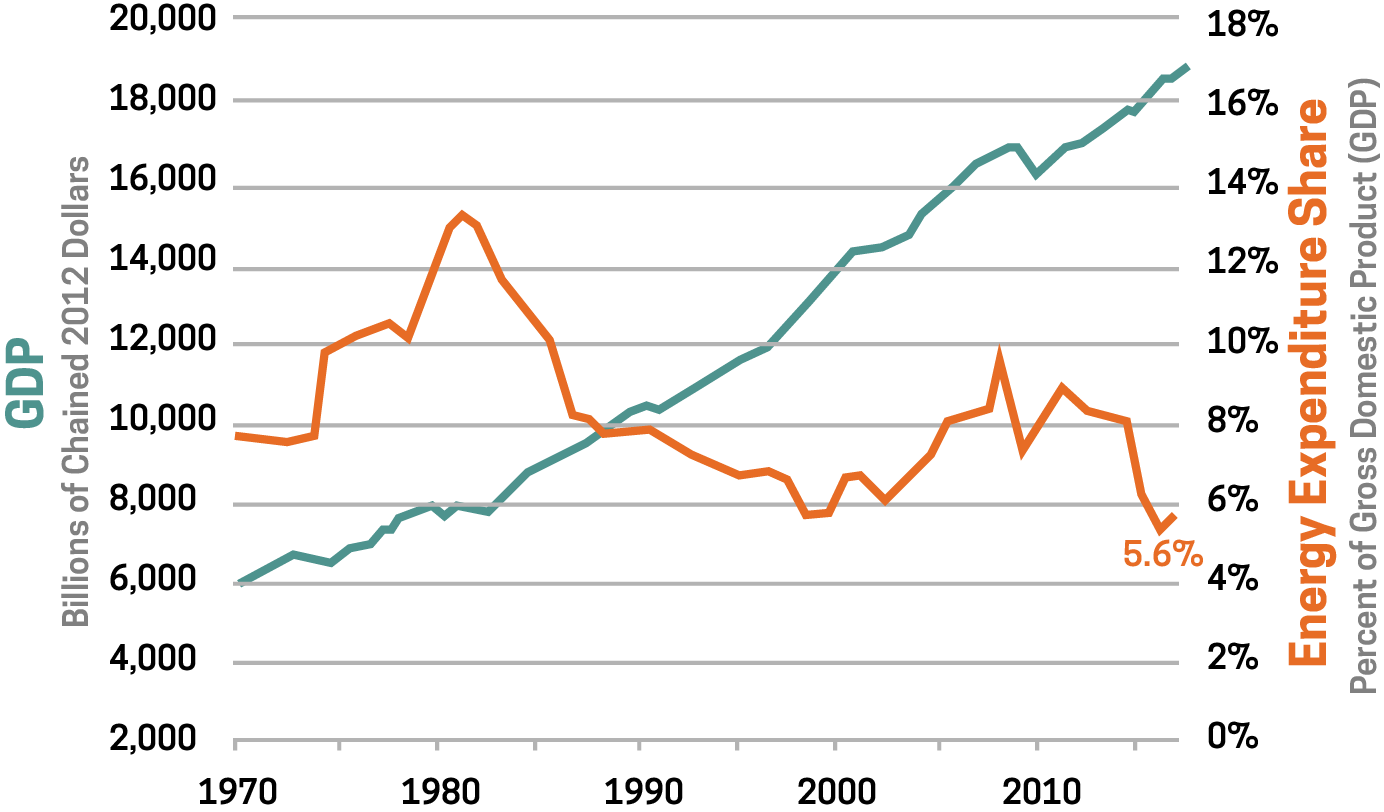
This chart shows the U.S. Gross Domestic Product (GDP) and the US energy expenditure share graphed together over roughly the last 50 years.
The GDP is defined as the total value of goods and services produced in the United States during a specified time.
The U.S. total energy expenditure is defined by the Energy Information Administration (EIA) as the amount of money spent to consume energy in the United States each year.
The energy expenditure share is the total energy expenditure measured as a percentage of the GDP.
Looking at the two graphed together in the chart above, we begin to see a story emerge concerning how well we’ve produced as a country over the last 50 years and how much we’ve spent on energy to achieve that production.
GDP, which does have its down years from time to time, has trended up for just about as long as it’s been measured. The energy expenditure share, on the other hand, has fluctuated wildly over the last half-century.
Consider the 5.6% energy expenditure share that occurred in 2016. That number is significant to everyone in charge of planning for his or her organization’s immediate future.
In 2016, the U.S. energy expenditure share was the lowest it has ever been in the history of the United States of America. Never before had U.S. GDP and energy expenditure share been farther apart than it was just three years ago.
That means, in 2016, the U.S. produced more than we ever had before and spent less on energy as a percentage of that production than at any other time in our country’s history.
The low energy expenditure share isn’t due to a lack of energy consumption in the U.S. The EIA reports the US total energy consumption has remained largely unchanged since 2013.
So why then has our energy expenditure share been so low? The EIA has officially stated the cause is “entirely due to low energy prices,” with abundant, cheap natural gas playing a big role in the overall trend.
Perhaps the better question for businesses to ask is how long is this ideal period going to last?
The short answer is it’s already over.
The EIA has reported that since 2016, average energy prices of motor gasoline, natural gas, and retail electricity have all increased, resulting in higher U.S. energy expenditures in 2017 (5.8%), the last year for which the data is available.
So what’s going to happen to energy prices in 2020? The Energy Information Administration thinks they’ll likely rise. Exactly how much is hard to say.
What this means, however, is that if your organization does everything exactly as it did during the boom of 2016-2017, your results in 2020 won’t be as strong, simply because you’ll have spent more on energy to achieve the same amount of productivity.
There’s an old saying about making hay while the sun shines. When conditions are right for what you do…do it. In the past few years, conditions in the U.S. have never been more right to produce. But those conditions have shifted.
Organizations that understand the nature of that shift as it relates to their energy use and spends are less likely to succumb to uncertainty and the paralysis it can induce when planning for the future.
Optimal productivity is your goal. If uncertainty is the villain standing between your organization and its objectives, then improved demand-side energy management may be the ally you need to help you get to the other side.
To learn more about how to offset the rising U.S. energy expenditure share, read CPower’s “Demand-Side Energy Management in the U.S. Manufacturing Industrial Sector: an analysis of revenue-generating strategies.“


