PJM in Motion (Environment + Energy Leader Webinar)

In 2015, PJM announced that it was retiring its seasonal emergency capacity demand response programs and replacing them with a single, year-round program called Capacity Performance, or CP. June 2020 was set as the first season that PJM would offer CP as their only capacity program.
June 2020 is just a few months away — and the world is a very different place from when CP was first proposed. Who knew PJM would solo their new emergency capacity program in the middle of one of the greatest upheavals in the last 50 years?
It’s no surprise that times of great flux and uncertainty bring more questions than there are answers for, and misinformation that can cloud the path to needed solutions.
CPower is committed to helping PJM energy users get a better understanding of the facts, clarify the misperceptions, and identify opportunities that still exist in this unprecedented year of change and complexity.
That’s why we’re bringing together our top experts on PJM and Capacity Performance in this timely and important webinar.
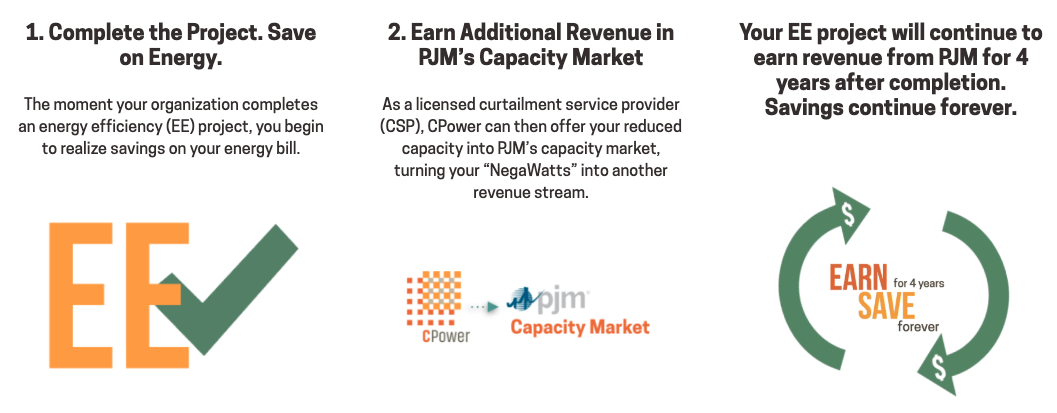
Monetizing Energy Efficiency Projects (Video)

Submit your question to the Energy Engineer’s Notebook:
Fill out the form below and your question may be the subject of an Energy Engineer’s Notebook episode.
(If your question isn’t selected for an episode, a CPower engineer will get back to you with an answer.)
What is Zonal Aggregation?
In 2019, PJM adopted new rules that allowed customers to contribute different seasonal load values if their curtailment service provider (CSP) can find an offsetting match for the lesser of the two seasonal values within that particular zone.
This practice is called zonal aggregation.
In short, zonal aggregation is what enables a given customer to contribute different seasonal load values in PJM’s Capacity Performance demand response program, which otherwise requires a single year-round load drop value from its participants.
Before we get into the details of how zonal aggregation works, let’s review the rules (and customer concerns) of PJM’s year-round demand response program.
Capacity Performance
Heading into 2020, a common concern many organizations that had previously participated in PJM’s summer-only demand response went something like this: will we have enough winter load to satisfy the new year-round participation requirements?
It’s a valid concern given Capacity Performance’s parameters which essentially state that a participant has both a winter load drop value and a summer load drop value. Those values can be different, but the lesser of the two values is what PJM counts as a given organization’s year-round load value.
Let’s put some numbers to the example above. If an organization has, say, 5 MW of curtailable load in the summer but only 2 MW in the winter, then the organization’s year-round load would be 2 MW–the lesser of the two values.
To its credit, PJM realized it had roughly 50% more potential capacity in the summer than winter and that quality seasonal capacity was essentially being kept on the sidelines. The RTO realized it had to make a change.
Enter zonal aggregation.
How Zonal Aggregation Affects CP
Let’s turn back to our example of a customer with 5 MW of curtailable load in the summer but only 2 MW available in the winter.
Instead of having to enroll for the year at the lesser load value (2 MW), the customer can contribute 5 MW of load reduction in the summer and 2 MW in the winter if (and only if) the curtailment service provider (CSP) they’re working with can find another customer in the same zone with 3 MW of excess winter load reduction to offset the original customer’s shortage.
This creates what is called a CP aggregation within the CSP’s demand response portfolio.
Bigger really is better (when it comes to zonal aggregation portfolios)
Organizations seeking to participate in Capacity Performance and contribute different seasonal load drop values through zonal aggregation need to work with a licensed CSP with–and this is important– a sizable CP aggregation in its demand response portfolio.
Why, in this case, does the size of the aggregation portfolio matter?
Consider a small CSP that has just a few organizations’ loads in its portfolio. What are the chances this small CSP is able to find a seasonal load match for a particular organization in a particular zone? Not likely.
On the other hand, a CSP with a large aggregation portfolio that includes loads of many organizations located in many zones is much more likely to be able to find the same offsetting match.
This post was excerpted from the 2020 State of Demand-Side Energy Management in North America, a market-by-market analysis of the issues and trends the experts at CPower feel organizations like yours need to know to make better decisions about your energy use and spend.
CPower has taken the pain out of painstaking detail, leaving a comprehensive but easy-to-understand bed of insights and ideas to help you make sense of demand-side energy’s quickly-evolving landscape.
2020 State of Demand-Side Energy Management in North America
Resource Adequacy in PJM: too much a good thing?
PJM has been criticized of late (along with several other grid operators in the US) of over-procuring resources in its capacity market. At 29% in 2019, PJM had the second-highest anticipated reserve margin among deregulated energy markets in the US.
Over the past ten years, PJMs system peaks have been flat or declining, highlighting the region’s over-forecasting woes.
In PJM’s defense, there are two significant reasons why the RTO has consistently taken a long position on resource procurement. Both have the rate-paying customer in mind.
For one, if PJM has the option to buy cheap capacity due to there being an abundance of it, they buy it. Consider the alternative, if less capacity were available it would cost more and eventually ratepayers would end up seeing higher prices on their electricity bills.
Next, PJM has historically over forecast its requirements, resulting in the RTO purchasing a good deal more capacity than it needs in the Base Residual Auction (BRA) and selling it back in the Incremental Auctions (IAs), which are held so PJM can make exactly those kinds of adjustments.
Over procurement of resources isn’t necessarily a bad thing, but PJM is nonetheless seeking to improve its load forecasting methods.
Exactly what that will entail is yet unknown, but any adjustment will likely affect capacity prices in future forward capacity auctions, potentially driving them down since PJM will be seeking less capacity once its forecasting is honed.
That’s in the future. Let’s spend the next few minutes looking at what’s affecting PJM’s present and subsequent push to tomorrow.
PJM’s drive to the future
Every deregulated energy market in the US is working to evolve its grid’s fuel mix from fossil-based sources to those that are cleaner and more renewable. To borrow an archetype from a fable we all know, some markets–California, New York, and New England, for example–have chosen to sprint ahead like rabbits and lead the march toward energy’s future.
PJM prefers to play the role of the tortoise, opting for a much slower evolution of its grid. Their logic is sound. Let the other markets take an early-adopter position and learn from their wins and mistakes. All the while, work to keep the grid at home reliable and the rates reasonable for consumers.
That steady-as-we-go attitude helps explain that while PJM is working to integrate distributed energy resources onto its grid, there currently aren’t ample opportunities to monetize these resources in the marketplace.
Monetizing DERs in PJM
Currently, there are no opportunities to monetize front-of-the-meter distributed generation in PJM. Few opportunities exist behind the meter, either. That will likely change in the near future. Before we get into the reasons why, let’s define DERs and explain how they interact with the grid.
Distributed Energy Resources (DERs) are, technically-speaking, resources that are connected to the grid at the distribution level rather than at the transmission level. The distinction is important to energy wonks because the rules in PJM for connecting to distribution lines differ from the rules for connecting at the transmission level.
Resources that are in front of the meter (meaning they do not serve a retail load directly) are treated the same in the market place as any other resource, once they’re connected to the grid. Many DERs, however, are behind the retail meter and help offset customer loads purchased from the grid.
As long as the DER does not inject into the grid (i.e. generate more kW than there is load) the DER can be treated as demand response. However, if the DER is able to inject and offset the owner’s load, things get really complicated, especially if the owner can curtail load (shut down processes, reduce lighting, etc) in addition to operating energy sources.
Commercial and industrial organizations especially desire DERs and have been implementing them behind their meters for the last several years. They’re doing this for their own reasons, namely to reduce demand, transmission, and energy costs while upping their organization’s resilience. If the economics are right, there is no reason to think behind-the-meter DER implementation won’t grow in the future.
If PJM doesn’t soon devise ways to allow these popular resources to be monetized, the grid operator may find itself in the unenviable position of not having enough demand-side resources to call on during times of grid stress or unusually high prices. That’s because the more organizations incorporate behind-the-meter distributed resources to generate their own electricity the less load they’re drawing from the grid. The consumers’ meters are essentially dropping, meaning they are consuming less electricity from the grid. This inevitably leads to less load that the grid can call on via demand response when the grid is stressed or electricity prices are high. PJM’s forecasting takes this loss of load into account and therefore needs less load to procure.
PJM is working on these issues, but progress has been slow.
This post was excerpted from the 2020 State of Demand-Side Energy Management in North America, a market-by-market analysis of the issues and trends the experts at CPower feel organizations like yours need to know to make better decisions about your energy use and spend.
CPower has taken the pain out of painstaking detail, leaving a comprehensive but easy-to-understand bed of insights and ideas to help you make sense of demand-side energy’s quickly-evolving landscape.
Seasonal Readiness 2020
Webinar: State of the PJM Energy Market (SOTM Series)
How to Monetize Electricity from Waste Stream Recovery
According to the U.S. Department of Energy, an estimated 20-50% of industrial energy input is lost as waste heat.
Many industrial organizations in the U.S. have learned how to recover waste heat, yet few understand how to monetize it.
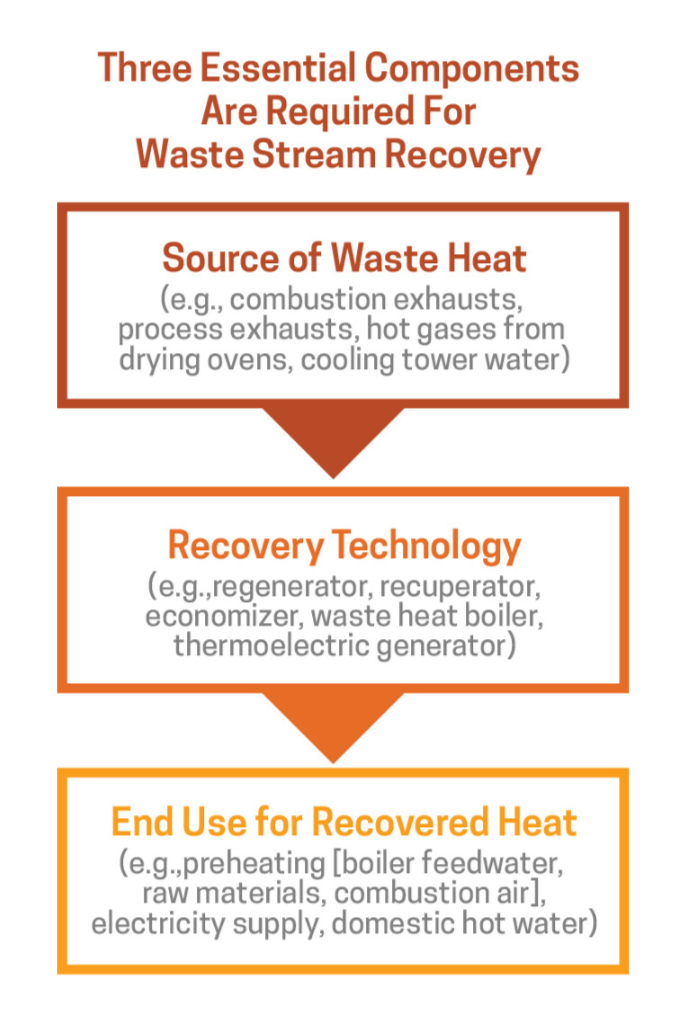
Industrial waste heat is the energy generated in an industrial process that is not put to practical use. Waste heat sources include hot combustion gases discharged to the atmosphere, heated products exiting industrial processes, and heat transfer from hot equipment surfaces.
Waste stream recovery involves capturing and reusing waste heat for the purpose of heating or for generating mechanical or electrical work.
Example uses for recovered waste heat include:
- Generating electricity
- Preheating combustion air
- Preheating furnace loads
- Absorption cooling
- Space heating
Types of industrial manufacturers that are good candidates for waste heat recovery include:
Glass Manufacturing–Regenerators and recuperators are the most frequently used systems for waste heat recovery in the glass industry, which collectively consumes approximately 300 TBtu/year.
Cement Manufacturing–The cement industry consumes about 550 TBtu/year with its most energy-intense processes including those which mine and prepare raw materials for the kiln, clinker, production, and cement milling. Options for heat recovery include preheating meal and power generation (cogeneration).
Iron and Steel Manufacturing–Consuming approximately 1,900 TBtu of energy per year, the U.S. iron and steel industries are prime candidates yet face a challenge for executing economically sound heat recovery. While recovery from clean gaseous streams in these industries is common, heat recovery techniques from dirty gaseous streams (from coke ovens, blast furnaces, basic oxygen furnaces, and electric arc furnaces) often incur high capital investment costs.

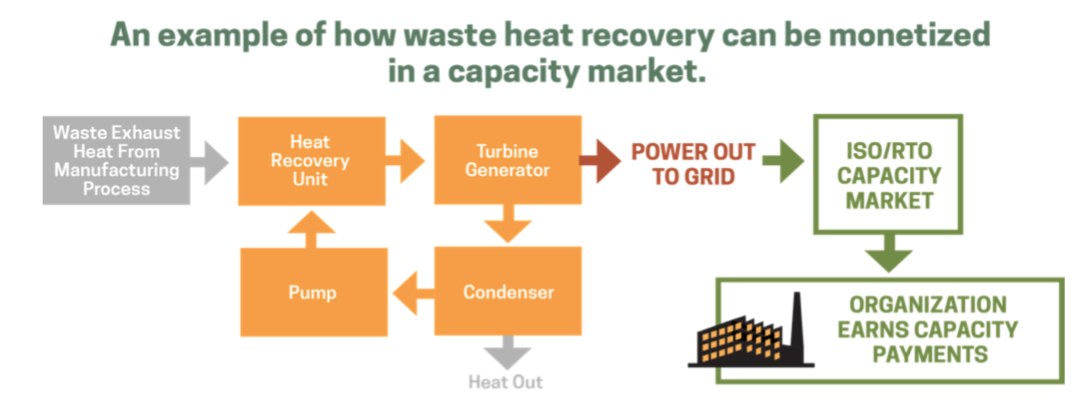
In several deregulated markets in the U.S.–PJM, for example–recovered waste heat can be monetized by offering the recovered resource into the region’s forward capacity market.
Forward capacity markets like PJM’s Reliable Pricing Model (RPM) allow the grid operator to procure the grid’s required capacity in advance of its delivery day.
Implemented in 2007, PJM’s Reliability Pricing Model uses a market approach to obtain the capacity needed to ensure its grid’s reliability.
The RPM’s market approach includes incentives that stimulate investment in existing generation from traditional sources like power plants while encouraging the development of other resources such as demand response and energy efficiency.

In many cases, organizations that are already participating in waste stream recovery can realize easy earnings akin to found money that requires little work to obtain other than offering the recovered resource into the market.
To learn more about monetizing waste stream recovery and how to offset the rising U.S. energy expenditure share, read CPower’s “Demand-Side Energy Management in the U.S. Manufacturing Industrial Sector: an analysis of revenue-generating strategies.”


