Our Blog On-Demand
Content
Knowledge Hub
Knowledge Hub


The Virginia Beach City Public School System is on a mission. At the heart of that mission lies a commitment to education, which you’d expect from the largest school division in southeastern Virginia. What you might not expect is how money earned from participating in demand response programs is helping fund the VBCPS’ drive toward academic excellence.
Ranked the fifth best large school division in the entire nation by GreatSchools, Virginia Beach City Public Schools (VBCPS) has earned a reputation for fostering a culture of outstanding academics.
That’s not all the school division has earned lately.
Since 2014, VBCPS has also earned over $250,000 through demand response and demand management. The increased revenue has helped pave the way for a sustainable future of energy efficiency and academic achievement.
Compass to 2020
VBCPS’ Charting the Course initiative was launched in 2015 to set the vision of school division over the next five years. The strategic framework includes four goals – high academic expectations, multiple pathways, social-emotional development, and culture of growth and excellence – and multiple strategies to guide this important work. This focus on excellence at VBCPS extends into their drive towards energy efficiency and sustainability initiatives across their entire K-12 campus system and facilities.
VBCPS understands the importance of conserving resources and protecting our environment. Among the nearly 70,000 students and approximately 15,000 employees are the often unique and innovative conservation efforts that can be found in every office and school in the division. As a testimony to this commitment, they have embraced Demand Response participation with support at all levels of the organization, from the office of the president to the facilities personnel, faculty, and students.
The Opportunity
VBCPS has been participating in the PJM Emergency Capacity DR and Energy Efficiency programs with CPower since 2013. They participate through the State Contract E194-1378 administered by the Department of Mines Minerals and Energy (DMME), which has joined forces with CPower to bring enhanced Demand Response services to Virginia.
VBCPS has 85 schools, 13 of which were registered in 2016 to participate in the Emergency DR program. The peak load of the 13 school campuses is 9.6MW of which they curtail 8MW when called upon to reduce load during times of grid emergencies. Since 2014, their efforts have brought in earnings of over $250,000, which they have used to fund additional efficiency projects to support campus-wide sustainability goals.
Consistent Success
VBCPS staff at each participating school takes ownership of their Demand Response participation and have consistently over-performed each season thanks to:
Challenges and Lessons Learned
Some initial challenges included managing data from multiple utility meters as well as different building automation systems (BAS). However, the methods used above with site-specific planning allowed VBCPS to overcome the hurdles. Some sites have an Easy Button and use an automated approach while some utilize a more detailed hands-on approach.
In the end, clear communications and reliable equipment/metering are key factors for consistent performance. For instance, there was an emergency event called at the end of the season in 2013, where VBCPS delivered per their commitments even though school was fully in session. The schools also got the added benefit of earning energy payments from that event.
Forward-Thinking towards a Sustainable Future
Additionally, in 2014 the team pioneered the State of Virginia Energy Efficiency effort with lighting upgrades across the division footprint. They embraced the energy efficiency program, connecting CPower with their contractors to get the required information of qualified projects, and ultimately will earn close to $100,000 for their efforts.
Looking to the future, VBCPS has consistently added load reductions to their commitment to support grid reliability. They have added 8 more schools with an additional 2.8 MW of curtailable load to participate in the 2017 PJM performance season program, and are also exploring the PJM Economic DR program. Four new lighting upgrades from the spring of 2017 were submitted to the PJM Energy Efficiency program. The team at VBCPS are a powerful asset to demand response. By providing their operating procedures as a starting point to other participants, they have served as mentors for other schools – providing encouragement to their peers so they feel confident to take advantage of the program and optimize energy earnings and savings at other K12s across the Commonwealth.
Contact Leigh Anne Ratliff or anyone on CPower’s PJM team at www.CPowerEnergy.com/markets/pjm-interconnection-contact

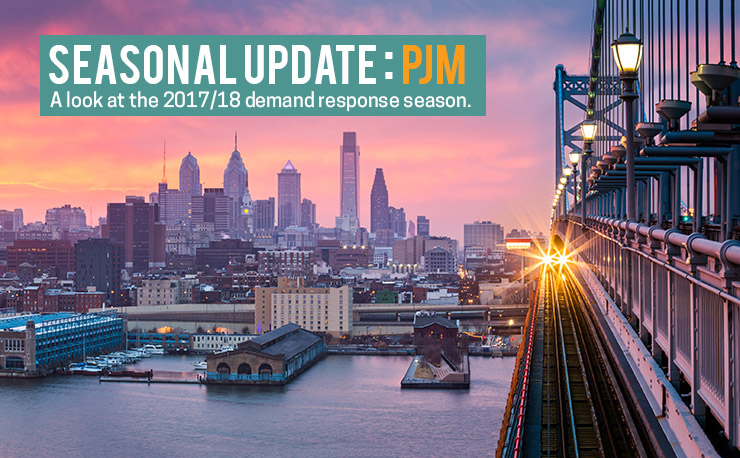
A changing weather landscape may bring early summer heat.
Although the recent La Nina season is officially over, we are experiencing a Mother Nature hangover as the 2017 Spring season has seen above normal temperatures. As we transition from La Nina to El Nino, we should expect the hotter than normal temperatures to continue through the early part of the summer in the PJM region. This should give way to cooler than normal late summer temperatures, which is opposite of what we saw during the 2016 summer season. Warmer temperatures early in the season could yield some emergency issues, especially localized transmission concerns, so be prepared early in the 2017/18 Demand Response (DR) season.
As usual, CPower tends to schedule the PJM mandatory test event early in the summer to ensure customers will have time to be retested in the event they under-perform. CPower customers should be on the lookout for our test event messaging.
Capacity Performance Non-Summer M&V changes take effect in 2017/18.
As part of PJM’s filing to FERC in November 2016, the Non-Summer Measurement and Verification (M&V) methodology for Capacity Performance (CP) has been changed starting with the 2017/18 season. The new Non-Summer M&V will be a Winter PLC construct. The Winter PLC will be based on the customer’s highest load value between 6am-9pm during PJM’s 5 Winter Peak Days. CP Demand Response customers will have separate Summer and Winter PLCs and FSLs for compliance purposes although the load reduction will be the same value for the entire season.
PJM ushers in a new era of Demand Response with the 2020/21 BRA.
In May of 2017 PJM will conduct its annual Base Residual Auction (BRA) for the 2020/21 season. This year marks the first year that Demand Response can only be Capacity Performance. Although there will be a mechanism for Summer seasonal DR resources to offer and clear as a CP aggregation, the overwhelming majority of DR that clears the BRA will be pure CP.
Prognosticators are reviewing the auction parameters and making predictions on clearing prices. Although capacity resources are expected to exit the market under the new CP construct, PJM has also lowered their load forecast, causing many to believe the CP price could clear flat compared to last year. There is, however, reason to believe that there could be significant premiums in EMAAC and COMED due to limited CP resources and transmission constraints. One can never predict participant behaviors which is a variable that always makes price prediction an interesting but inexact science.
During the 2020/21 season, many traditional “summer only” DR customers will be forced to participate as annual resources in the CP program at potentially a lesser load drop commitment, while others may leave the market entirely. CPower would like to work with all DR customers to maximize their participation and find ways to keep them in the program as either CP enrollments or part of a CP aggregation.
To learn more about PJM’s changing market or about how to be better prepared for potential grid instability this summer, contact Dann or any member of the CPower’s PJM Team.

Many customers as well as my colleagues at CPower often ask me about the benefits of installing reliable metering equipment to access energy data in near real time. I typically respond with a handful of advantages (some listed below), but even before going there I find it useful to explain the full context about why these are important.
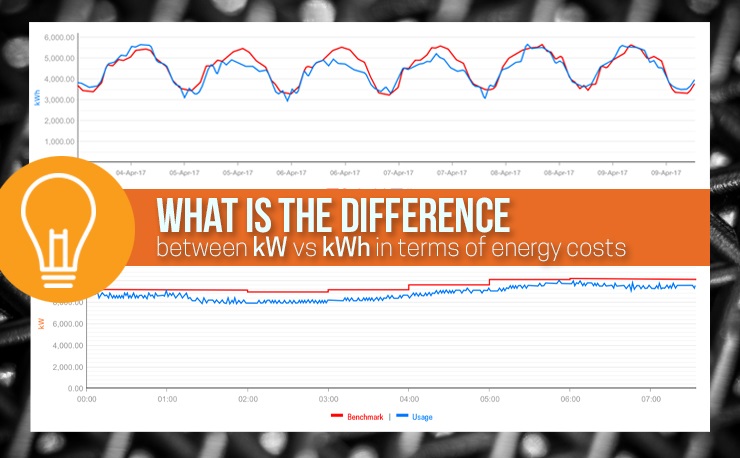
No discussion on the topic would be complete without a basic understanding of Demand (measured in kilowatts or kW) versus Consumption (measured in kilowatt hours or kWh). This is key to making the right choices when it comes to reducing energy costs, since electricity use for a commercial/industrial customer is typically billed and metered after taking at least these factors into consideration:
So, what’s the big deal between kW vs kWh?
An analogy using traditional light bulbs can help: Consider a single 100W bulb lit for ten hours versus ten 100W bulbs lit simultaneously for one hour. In both scenarios, the total cumulative “consumption” is 1,000 watt-hours (or 1 kWh). In the first case, however, the single light bulb will “demand” 100W or 0.1 kW from the electric supplier. Thus, the utility must have that 0.1 kW ready whenever that bulb is switched on. But note how the second scenario impacts the utility from a “demand” perspective. The electric supplier in this case must be ready to deliver 10x as much ‘capacity’ in response to the demand of the 10 light bulbs burning simultaneously!
Quite simply, here’s the difference. If these two scenarios reflected the behavior of two different customers, and if they were each billed for only their consumption, then both would get the same bill (for 1 kWh of energy used) even though the burden placed on the utility to meet each customer’s energy requirement is very different. Among other reasons, this is primarily why C&I (as opposed to residential) customers are typically metered and billed based on both their hourly “consumption” patterns and their peak “demand” for energy.
Demand-side energy management in near real time
CPower’s savvy demand response (DR) customers effectively leverage the energy they consume as a facility asset. Our diverse customer base covers mid- to large-sized electricity users in commercial, industrial, government and institutional organizations, including water/wastewater pumping and treatment facilities, colleges and universities, public agencies, office campuses, cold storage, data centers and a wide range of manufacturing facilities, to name just a few.
Many of our most active DR participants nationwide additionally leverage real-time metering for its clear advantages, including more visibility and control over load reductions as well as better overall energy management and sustainability benefits. The image above shows just two of the many views available to users via the CPower App (the graph on top shows 7-day hourly interval consumption while the one below shows demand on an intra-day 1-minute interval chart).
Key reasons to get real-time metering installed at your facility:
The Bottom line
Real-time metering ultimately increases your DR earnings and savings to fund additional efficiency initiatives, while complementing your facility’s energy conservation and sustainability efforts. There are no out-of-pocket costs, since fees to install hardware, support software provisioning and enable data measurement & verification (M&V) are typically covered by DR program earnings.
By giving you near real-time visibility and analytics of your energy consumption, enhanced metering techniques provide more earnings and savings via greater control over your DR participation and greater awareness of electricity usage patterns (remember kW vs kWh!)

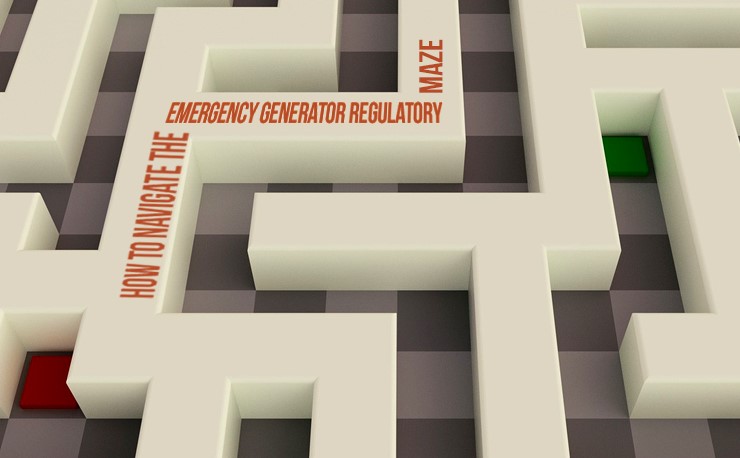
Is your organization one of the thousands of commercial/industrial energy customers that use back-up generators (BUGs)? Are they used as emergency generators (a.k.a., EGs or gensets) in demand response (DR) programs? If so, 2016 may have felt like an episode of the “Survivor” reality show, except instead of the usual cast of GenX characters and challenges you were unfortunately tasked with surviving a maze of ever-changing genset regulations.
Bad News, Good News: The past year saw important changes regarding the use of stationary reciprocating internal combustion engines (RICE) that continue to evolve at the federal level as administered by the U.S. Environmental Protection Agency (EPA), which itself is in now in the midst of changes with newly-confirmed administrator Scott Pruitt at the helm. EPA rules provide that BUGs that are intended for emergency use when blackouts occur are exempt from reporting requirements and most emissions regulations. The bad news is that EPA changes significantly restricted the circumstances where such generators can be compensated for operations while the grid is still up. The good news is many such generators can achieve “non-emergency” status without equipment upgrades by meeting specific permitting and reporting requirements.
Bit of History – 50-hour Rule No Longer Applies: In early 2016, it was determined that EGs could potentially participate in DR programs under a different rule (referred to as the “50-hour rule”). A coalition of DR providers including CPower took specific steps to clarify the applicability of the 50-hour rule with EPA as well as explore avenues to address concerns with the prior 100-hour rule as related to EG use for DR:
Further confounding the situation is that a generator classified as “nonemergency” under federal regulations could be deemed “emergency” under state and/or local regulations. Recent examples include the Rule 222 that applies to permitting in New York; while California is moving from the traditional environmental permitting approach towards utility-based restrictions.
What This Means to You: As a DR participant with EGs, you should always be aware of the nuances defining EG assets that do not meet EPA’s interpretations of local requirements as well as the Federal Non-Emergency standard for DR curtailments. This applies even if your current DR service provider may advise you otherwise (especially regarding the use of EGs via the 50-hour rule). Any reputable vendor certainly should not expose you to any potential EPA violations or penalties. And if you indeed find out that EGs are not permitted for use in DR programs, make sure your service provider has an experienced engineering team who is willing to work with you to achieve the best possible alternative curtailment strategies.
On the Positive Side: Again, the good news is that in many instances, you can still use EGs to participate in DR programs and support grid reliability. A good curtailment service provider or DR aggregator should be able to assist clients with specific steps for permitting and retrofits so their engines can still participate wherever possible. At CPower, we have helped several clients with permitting so their engines can now effectively participate in emergency DR events to support the grid. Some of these services include:
Bottom Line: As capacity costs increase, active DR participation becomes even more compelling and relevant. Changes in EPA regulations have impacted the ability of DR customers like you to use stationary emergency generators as part of your load reduction strategies. Luckily, you can look to DR service providers to offer valuable “survival tips” that can bring this episode to a stable ending.
“Thanks to accurate guidance from CPower’s engineering team, our engines were successfully permitted for use in demand response by the state’s Department of Environment. Their in-depth knowledge and tenacity throughout the process clearly contributed to enabling our facilities’ continued participation in the 2017 DR performance season.” – Facilities Director at a large New England based manufacturing firm.
CPower takes a leadership role and shaping market transformation while advocating for our customers to help you navigate the regulatory maze and maximize DR program benefits. The result? Increased energy savings and earnings not just from optimized participation in Emergency DR, but also in non-emergency voluntary programs (like price based Economic DR). In some cases, you can also use your engines for peak-shaving to reduce capacity costs while maintaining compliance with environmental regulations.
Do you have a generator? Does it meet State and EPA guidelines? Are you leveraging it as a demand response revenue resource? Check out our Emergency Generator Decision Tree today to ensure you make the right EG permitting and compliance choices moving forward.

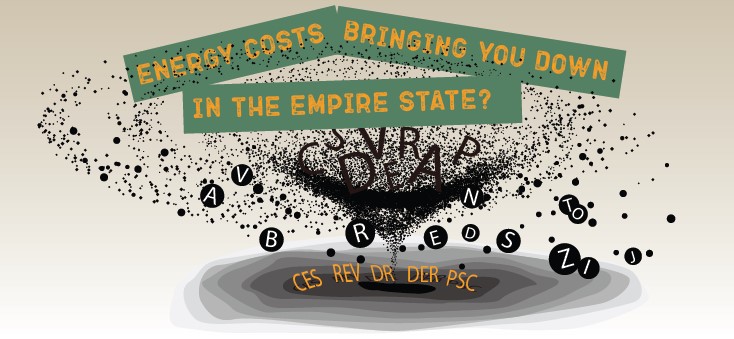
If you’re a mid- to large-sized energy user in New York, you’ve likely come across a veritable alphabet soup of acronyms: REV, CES, DR, DER…the list goes on. Many of you who run commercial and industrial (C&I) businesses know that you can actively leverage Demand Response (DR) programs and earn revenue by curtailing load when called upon to do so during emergencies to support grid reliability. Granted, some years have been more rewarding than others since capacity prices ebb and flow in New York just like in other energy markets. Of course, capacity prices have risen substantially since 2012, resulting in increased earnings from DR participation in New York. So what can DR participants across New York expect in 2017 and beyond?
First, a bit of context on REV and CES:
In 2012, Hurricane Sandy hit the East Coast, causing devastation and leaving millions without power. Shortly thereafter, working with the New York governor’s office, New York Power Authority and other state agencies, the Public Service Commission (PSC) launched the landmark Reforming the Energy Vision regulatory proceeding. Now commonly referred to as REV, its goal is to make the power system cleaner, resilient and more affordable. Regulators aim to transform traditional utilities into platform providers — entities that facilitate the deployment of distributed energy resources (DERs) and use them instead of traditional infrastructure. And Demand Response is poised to continue to play a vital role as this initiative evolves.
In simplest terms, the Clean Energy Standard (CES) mandates New York to acquire 50% of its energy from clean resources by 2030. As part of this, it seeks to further that goal by providing zero-emission credits (ZEC) to support upstate nuclear plants that were in danger of closing. In late 2016, the PSC fended off numerous challenges to its adoption of the CES and its subsidy for nuclear power generators. Keep an eye on this space, however, as the PSC’s order doesn’t mean this is finalized (as of this writing in Feb 2017, two court challenges remain pending). Generators and some environmental advocates said the ZEC program — which critics say will cost over $7 billion over its 12-year lifespan — goes beyond the authority granted to the PSC by state law.
Impact on your bottom line:
In the near term at least, REV and CES, while noble causes, are going to lead to increased fixed costs (~$4/MWh) on mid- to large-sized energy consumers. This scenario, however, also presents additional opportunities and specific actions you can take today to offset these costs:
New DR Programs: Both the NYISO and New York Electric Utilities offer demand response programs that pay businesses like yours for using less energy when the grid is stressed. Many commercial and industrial businesses in New York aren’t aware of the new summer-only local utility programs available to them via an authorized DR services provider. These programs offer another revenue stream in addition to the NYISO DR program that they may have been enrolled in for years. In 2016 for example, the New York Public Service Commission mandated that local utilities provide a Commercial System Relief Program (CSRP) throughout their entire service territory as part of a statewide effort to develop a new regulatory framework which includes incentives to leverage the deployment of distributed energy resources such as demand response.
Capacity Tag Management: Additionally, there are demand management services that can help significantly lower your capacity charge which make up 20-40% of the total supply portion on your monthly utility bill. The capacity charge is based on your individual capacity tag which, in New York, is determined by your facility’s usage when the NYISO sets its single annual peak hourly demand across the whole system. CPower sends an advanced day ahead demand management notification to reduce your usage when it is likely the NYISO will hit its hourly peak demand, thus reducing your capacity tag and capacity charges for the following year.
In the end, it’s all about implementing smarter techniques to manage your overall energy spend. The NYREV was launched 3+ years ago but it’s more relevant now than ever to survive as a large C&I energy user, as it will certainly change how energy is transacted in the future. At CPower, our job is to stay abreast of these developments and keep you informed about their potential impact. To get started, check out the various programs available in NY and informational videos to learn more on how you can offset rising energy costs in 2017 and beyond.

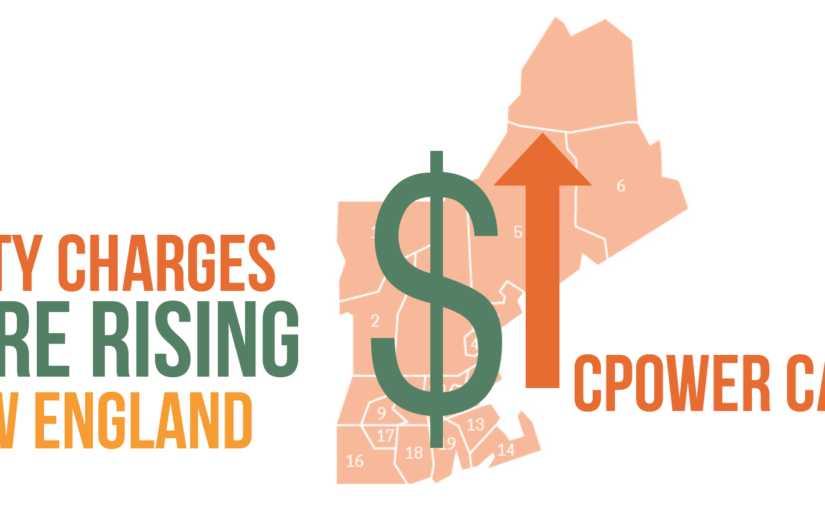
In the New England electric power market, sharply rising capacity costs and energy volatility in the New England power market will increase your electricity costs despite relatively low fuel prices and flat usage trends. This white paper explores the underlying reasons, and goes on to explain specific actions commercial and industrial customers can take to mitigate these cost increases.
ISO New England (ISO-NE) is responsible for keeping electricity flowing across the six-state New England region: Connecticut, Maine, Massachusetts, New Hampshire, Rhode Island, and Vermont. In so doing, ISO-NE’s core mission is system reliability.
To ensure reliability ISO-NE oversees the day-to-day operation of New England’s electric power generation and transmission system to keep the energy that generators supply to the grid in near-perfect balance with consumers’ energy demand. To ensure the system maintains adequate generating and transmission capacity to serve current and future needs ISO-NE manages a comprehensive regional pwoer system planning process and the region’s competitive wholesale electricity markets.

In this white paper, CPower’s Mike Hourihan aims to explain how recent events have played a role in shaping both the New York Energy Market’s current state and its evolution. He’ll also attempt to predict what might be in store for the market and how he believes New York businesses can position themselves to better manage their energy today and in the future.

Energy policy development is complicated. Recall that the electric industry has been regulated for more than 100 years and it remains highly regulated today, even with competitive markets. Moreover, both the Federal government and States have roles to play in regulation. Using examples, this article focuses on federal jurisdiction over “wholesale” electricity that flows across state lines and is not sold for direct consumption to end users. Sales to end users, including authorization of competitive retail suppliers, is the exclusive jurisdiction of the states.
In the U.S., policy at the highest level is established by Acts of Congress and the President. It is implemented by the executive branch including the Federal Energy Regulatory Commission (FERC) and the Department of Energy (DoE). This policy establishes a framework for the tariffs that govern the use of the nation’s electric transmission grid. It is useful to think of this framework as a “top down” process. The owners and operators of the transmission grid, in turn, submit tariffs that comply with the law and policy to FERC for approval. The development of tariffs is a “bottom up” process.
Three examples of the biggest orders to come out of FERC during President Obama’s administration include FERC Order 745, which required ISOs and RTOs to pay customer-side capacity resources such as demand response an equivalent value to what power plants and other supply-side resources earn; FERC Order 755, which required ISOs to create programs to reward “fast-responding” resources such as batteries for frequency regulation; and FERC Order 1000, which has set up a new regime for transmission operators and utilities to plan for, and pay for, regional grid investments.
The FERC has been instrumental in creating Regional Transmission Operators (RTOs) through policy decisions. RTOs and Independent System Operators (ISOs) have largely eliminated the need to set wholesale electricity prices by a fixed tariff and instead allow prices to be established by markets. The detailed implementation of electric policy is done at the RTO level. FERC’s decisions and orders apply to the tariffs of ISOs and RTOs that run much of the U.S. power grid. About 70 percent of the country is served by ISOs and RTOs, which fall under federal jurisdiction because they cross state lines.
The shift to RTOs has not eliminated the need for regulation of electricity. Instead it has shifted the regulatory focus from setting prices to setting market rules. The market rules are embodied in the RTO tariffs. The FERC is responsible for approving the RTO tariffs. The RTO tariffs are developed with varying degrees of stakeholder input, depending on the RTO itself. The basic process follows the steps from stakeholder consideration to RTO and final review and approval by FERC using stakeholder input as shown below:

Each RTO handles stakeholder consideration differently. PJM Interconnection, for example, is the only RTO that is required to accept stakeholder recommendations as determined by a vote – at least on some issues. Other RTOs simply consider the input of stakeholders and file what they think best. There is little doubt that PJM has the most robust process. Most issues are addressed through a series of meetings that follow a set process. The process is not unlike a government legislative body with committees, subcommittees, etc. Often stakeholders reach consensus and many issues are resolved with no or nominal opposition.
Demand Response Policy Considerations
Perhaps one major exception to consensus pertains to issues involving capacity market design, including Demand Response (DR) participation. On these issues, stakeholders are typically split between generation owners – including incumbent utilities – and load interests. This is because any changes that reduce the opportunity for generation participation or revenue leads to reduced income for generators. Such changes include enabling competitive resources such as DR and reductions in overall capacity requirements.
Conversely, stakeholders representing users of electricity oppose changes that increase costs without a credible probability of improving reliability. As a result, most controversial issues have competing proposals. Stakeholder votes are allocated in such a way that a required two-thirds’ supermajority (this applies to PJM) for approval of contested changes is difficult to reach. A deadlocked stakeholder process allows PJM to file changes that may not have broad stakeholder support. RTOs are non-profit entities without a commercial stake in market outcomes. However, as organizations, PJM and other RTOs have an inherent bias toward “reliability” which often results in costly requirements for more resources, especially conventional generation.
Stakeholders that oppose an RTO filing have the opportunity to “protest” the tariff changes at FERC. FERC need only determine that a filing is “just and reasonable”. While ostensibly the “just and reasonable” standard may include cost considerations, FERC, like PJM and other RTOs, also has a bias toward reliability and often will accept the RTO filing regardless of cost implications.
FERC Decisions and the Appeals Process
FERC decisions can be appealed to the federal courts on the basis non-compliance with the governing law, or an “arbitrary and capricious” decision. Appeals Courts avoid ruling on the substance of a FERC ruling because this can place the Court in the position of creating laws and regulations. Appeals Court decisions can be appealed to the Supreme Court as occurred in the high-profile case of FERC Order 745. In particular, owners of conventional generation (the petitioners) opposed the Order because the treatment of demand response threatened their revenues and they took FERC to court. The case hinged primarily on the issue of state versus federal jurisdiction (was the Order consistent with the Federal Power Act’s provisions designating retail rate setting as the exclusive jurisdiction of the states?).
In a major victory for the DR industry, the U.S. Supreme Court upheld FERC Order 745 via a 6-2 decision in January 2016, reversing a lower court opinion that found that it violated states’ jurisdiction over retail energy pricing, and dealing a blow to the utility group that brought the original lawsuit. DR providers and environmental groups supported FERC Order 745, noting that it has opened markets that have brought significant new demand-side capacity to the country’s grid operators for use in controlling the wholesale grid. Order 745 also helped reduce the need for fossil fuel-fired power and lowered overall electricity costs for consumers. But the underlying legal question behind the lawsuit — the bounds between federal and state jurisdiction over energy markets — could be modified by Acts of Congress.
You can see why the process of defining energy policy can be extremely complicated in practice. CPower takes a leadership role in shaping market transformation and regulatory reform, while working hard to maximize program benefits for our customers. It’s imperative that our Market Development team constantly stays abreast about regulatory processes as thought leaders in the DR community. These efforts enable us to provide services that take the complexity out of DR participation within the context of changing program rules, while optimizing your energy savings and earnings. This will become increasingly critical as energy markets continue to transform in the near future.

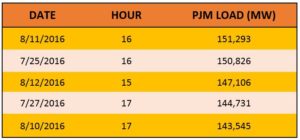
The 2016 PJM summer compliance season which runs from June through September has come to an end without a PJM-initiated emergency demand response (DR) event. The first six months of the year were already one of the warmest on record. So, for many of us sweating it out across the northeast, it was no surprise that this summer produced several heat waves that pushed system peaks to their highest levels in recent years. PJM’s top 5 system peaks (see table), reflect the summer’s weather and should be the Five Coincidental Peaks (5CP) that drive customers’ capacity charges through their Peak Load Contribution (PLC). It is important to note that any load reductions during these hours may reduce your capacity charges for next summer.
When it came to actual demand response events, however, a different picture unfolded compared to prior years. For instance, the 2013 summer saw system peaks at similar levels and was one of the most active summers for demand response customers ever. So you may ask: Why were no Emergency DR events called this summer, despite the heat and high system peaks? A few reasons come to mind:
Whatever the primary reason(s), PJM Emergency DR customers should take pride in their commitment to be on standby to reduce load when called upon. Your ability to curtail electricity consumption when needed by the grid is a tremendous asset to maintaining system reliability and preventing potential blackouts/brownouts.
This doesn’t mean that PJM may not have a reliability issue beyond the summer as the program year does run through May 2017. Also, while the summer period yields the greatest risk of an emergency event, demand response customers that have committed to curtailments all year should continue to be prepared to perform and reduce load if/when needed to support grid reliability.
Moreover, with the transition to the new CP product, demand response is morphing into a year-round program. Customers can start participating in CP now to get themselves prepared for the coming changes and earn additional capacity revenue in the process. Many forward-thinking facility managers are already thinking about how they may be able to participate beyond the summer and are reviewing effective winter curtailment strategies.
CPower would like to take this time to thank all demand response customers for their commitment to PJM reliability this summer. CPower customers can always review their load drop test and event performance in the CPower App and should be expecting summer performance reports and payments starting early November.
Last but not least, we always encourage all participants to stay tuned for earnings opportunities in other DR programs available. Many participants augment their demand response earnings from the capacity program via active participation in PJM’s voluntary programs such as (price based) economic demand response and (faster response) ancillary services such as synchronized reserves.
Please feel free to contact Dann or the CPower team if you have any questions. Our engineering team is happy to help you understand the nuances of participating in these programs and assist in optimizing your overall energy savings and earnings year round.