Demand response contributes more than just sustainability to K-12 public school system


The Virginia Beach City Public School System is on a mission. At the heart of that mission lies a commitment to education, which you’d expect from the largest school division in southeastern Virginia. What you might not expect is how money earned from participating in demand response programs is helping fund the VBCPS’ drive toward academic excellence.
Ranked the fifth best large school division in the entire nation by GreatSchools, Virginia Beach City Public Schools (VBCPS) has earned a reputation for fostering a culture of outstanding academics.
That’s not all the school division has earned lately.
Since 2014, VBCPS has also earned over $250,000 through demand response and demand management. The increased revenue has helped pave the way for a sustainable future of energy efficiency and academic achievement.
Compass to 2020
VBCPS’ Charting the Course initiative was launched in 2015 to set the vision of school division over the next five years. The strategic framework includes four goals – high academic expectations, multiple pathways, social-emotional development, and culture of growth and excellence – and multiple strategies to guide this important work. This focus on excellence at VBCPS extends into their drive towards energy efficiency and sustainability initiatives across their entire K-12 campus system and facilities.
VBCPS understands the importance of conserving resources and protecting our environment. Among the nearly 70,000 students and approximately 15,000 employees are the often unique and innovative conservation efforts that can be found in every office and school in the division. As a testimony to this commitment, they have embraced Demand Response participation with support at all levels of the organization, from the office of the president to the facilities personnel, faculty, and students.
The Opportunity
VBCPS has been participating in the PJM Emergency Capacity DR and Energy Efficiency programs with CPower since 2013. They participate through the State Contract E194-1378 administered by the Department of Mines Minerals and Energy (DMME), which has joined forces with CPower to bring enhanced Demand Response services to Virginia.
VBCPS has 85 schools, 13 of which were registered in 2016 to participate in the Emergency DR program. The peak load of the 13 school campuses is 9.6MW of which they curtail 8MW when called upon to reduce load during times of grid emergencies. Since 2014, their efforts have brought in earnings of over $250,000, which they have used to fund additional efficiency projects to support campus-wide sustainability goals.
Consistent Success
VBCPS staff at each participating school takes ownership of their Demand Response participation and have consistently over-performed each season thanks to:
- Excellent cross-functional preparation and pre-season on-boarding with their facilities personnel and the CPower team
- End-to-end communications/notifications exercise and load drop test conducted by CPower allows the VBCPS team to identify potential issues (if any) and take actions to fix them
- Effective curtailment planning strategies to optimize load reductions with minimal impact on campus staff and students
- Complete buy-in, approvals and support from the VBCPS school division management
- VBCPS facilities team has sharp focus on setting up a detailed process for participation based on each school’s timecards and student schedules/events
- Team expectations clearly; communications plan includes command central (radio, email, telephone, text) with notifications as early as possible
Regular meetings and clear internal communications (via newsletters, posters etc.) - Team expectations clearly; communications plan includes command central (radio, email, telephone, text) with notifications as early as possible
- Regular meetings and clear internal communications (via newsletters, posters etc.)
- Every year pre-season, the VBCPS team proactively updates their Demand Response informational guide and set of procedures
- With a total of 8 staff in Central Command and 30 across the other schools; they maintain 2-3 trained staff per school, with 1 person handling a specific event at each school and the rest at back -up in the case of vacations/illness. Moreover, experienced staff members act as mentors/trainers for others that are new to the program.
Challenges and Lessons Learned
Some initial challenges included managing data from multiple utility meters as well as different building automation systems (BAS). However, the methods used above with site-specific planning allowed VBCPS to overcome the hurdles. Some sites have an Easy Button and use an automated approach while some utilize a more detailed hands-on approach.
In the end, clear communications and reliable equipment/metering are key factors for consistent performance. For instance, there was an emergency event called at the end of the season in 2013, where VBCPS delivered per their commitments even though school was fully in session. The schools also got the added benefit of earning energy payments from that event.
Forward-Thinking towards a Sustainable Future
Additionally, in 2014 the team pioneered the State of Virginia Energy Efficiency effort with lighting upgrades across the division footprint. They embraced the energy efficiency program, connecting CPower with their contractors to get the required information of qualified projects, and ultimately will earn close to $100,000 for their efforts.
Looking to the future, VBCPS has consistently added load reductions to their commitment to support grid reliability. They have added 8 more schools with an additional 2.8 MW of curtailable load to participate in the 2017 PJM performance season program, and are also exploring the PJM Economic DR program. Four new lighting upgrades from the spring of 2017 were submitted to the PJM Energy Efficiency program. The team at VBCPS are a powerful asset to demand response. By providing their operating procedures as a starting point to other participants, they have served as mentors for other schools – providing encouragement to their peers so they feel confident to take advantage of the program and optimize energy earnings and savings at other K12s across the Commonwealth.
Contact Leigh Anne Ratliff or anyone on CPower’s PJM team at www.CPowerEnergy.com/markets/pjm-interconnection-contact
What to expect in the upcoming PJM 2017/18 Demand Response season as well as a 2020/21 BRA preview.

A changing weather landscape may bring early summer heat.
Although the recent La Nina season is officially over, we are experiencing a Mother Nature hangover as the 2017 Spring season has seen above normal temperatures. As we transition from La Nina to El Nino, we should expect the hotter than normal temperatures to continue through the early part of the summer in the PJM region. This should give way to cooler than normal late summer temperatures, which is opposite of what we saw during the 2016 summer season. Warmer temperatures early in the season could yield some emergency issues, especially localized transmission concerns, so be prepared early in the 2017/18 Demand Response (DR) season.
As usual, CPower tends to schedule the PJM mandatory test event early in the summer to ensure customers will have time to be retested in the event they under-perform. CPower customers should be on the lookout for our test event messaging.
Capacity Performance Non-Summer M&V changes take effect in 2017/18.
As part of PJM’s filing to FERC in November 2016, the Non-Summer Measurement and Verification (M&V) methodology for Capacity Performance (CP) has been changed starting with the 2017/18 season. The new Non-Summer M&V will be a Winter PLC construct. The Winter PLC will be based on the customer’s highest load value between 6am-9pm during PJM’s 5 Winter Peak Days. CP Demand Response customers will have separate Summer and Winter PLCs and FSLs for compliance purposes although the load reduction will be the same value for the entire season.
PJM ushers in a new era of Demand Response with the 2020/21 BRA.
In May of 2017 PJM will conduct its annual Base Residual Auction (BRA) for the 2020/21 season. This year marks the first year that Demand Response can only be Capacity Performance. Although there will be a mechanism for Summer seasonal DR resources to offer and clear as a CP aggregation, the overwhelming majority of DR that clears the BRA will be pure CP.
Prognosticators are reviewing the auction parameters and making predictions on clearing prices. Although capacity resources are expected to exit the market under the new CP construct, PJM has also lowered their load forecast, causing many to believe the CP price could clear flat compared to last year. There is, however, reason to believe that there could be significant premiums in EMAAC and COMED due to limited CP resources and transmission constraints. One can never predict participant behaviors which is a variable that always makes price prediction an interesting but inexact science.
During the 2020/21 season, many traditional “summer only” DR customers will be forced to participate as annual resources in the CP program at potentially a lesser load drop commitment, while others may leave the market entirely. CPower would like to work with all DR customers to maximize their participation and find ways to keep them in the program as either CP enrollments or part of a CP aggregation.
To learn more about PJM’s changing market or about how to be better prepared for potential grid instability this summer, contact Dann or any member of the CPower’s PJM Team.
CPower signs contract with PECO to help business customers in Pennsylvania reduce electricity demand during peak hours

CPower signs contract with PECO to help business customers in Pennsylvania reduce electricity demand…
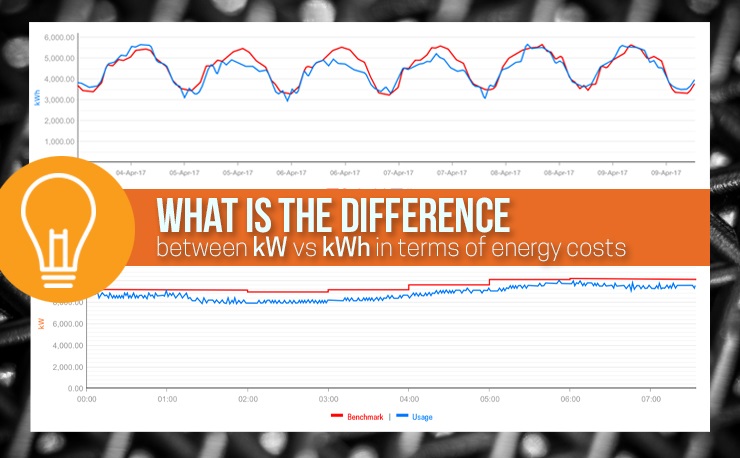
Understanding kW vs kWh (and Meter Data) to Lower Your Utility Bills

Many customers as well as my colleagues at CPower often ask me about the benefits of installing reliable metering equipment to access energy data in near real time. I typically respond with a handful of advantages (some listed below), but even before going there I find it useful to explain the full context about why these are important.
No discussion on the topic would be complete without a basic understanding of Demand (measured in kilowatts or kW) versus Consumption (measured in kilowatt hours or kWh). This is key to making the right choices when it comes to reducing energy costs, since electricity use for a commercial/industrial customer is typically billed and metered after taking at least these factors into consideration:
- Maximum kilowatt use (or kW demand) during a given period, typically in 15- or 30-minute intervals, and
- Total cumulative consumption (in kWh).
So, what’s the big deal between kW vs kWh?
An analogy using traditional light bulbs can help: Consider a single 100W bulb lit for ten hours versus ten 100W bulbs lit simultaneously for one hour. In both scenarios, the total cumulative “consumption” is 1,000 watt-hours (or 1 kWh). In the first case, however, the single light bulb will “demand” 100W or 0.1 kW from the electric supplier. Thus, the utility must have that 0.1 kW ready whenever that bulb is switched on. But note how the second scenario impacts the utility from a “demand” perspective. The electric supplier in this case must be ready to deliver 10x as much ‘capacity’ in response to the demand of the 10 light bulbs burning simultaneously!
Quite simply, here’s the difference. If these two scenarios reflected the behavior of two different customers, and if they were each billed for only their consumption, then both would get the same bill (for 1 kWh of energy used) even though the burden placed on the utility to meet each customer’s energy requirement is very different. Among other reasons, this is primarily why C&I (as opposed to residential) customers are typically metered and billed based on both their hourly “consumption” patterns and their peak “demand” for energy.
Demand-side energy management in near real time
CPower’s savvy demand response (DR) customers effectively leverage the energy they consume as a facility asset. Our diverse customer base covers mid- to large-sized electricity users in commercial, industrial, government and institutional organizations, including water/wastewater pumping and treatment facilities, colleges and universities, public agencies, office campuses, cold storage, data centers and a wide range of manufacturing facilities, to name just a few.
Many of our most active DR participants nationwide additionally leverage real-time metering for its clear advantages, including more visibility and control over load reductions as well as better overall energy management and sustainability benefits. The image above shows just two of the many views available to users via the CPower App (the graph on top shows 7-day hourly interval consumption while the one below shows demand on an intra-day 1-minute interval chart).
Key reasons to get real-time metering installed at your facility:
- You can identify unusual or erratic equipment behavior to help avoid catastrophic failure. This is from a recent real-world example: Our team at CPower was working with the operations team for a large commercial real estate and property management firm, and picked up on unusual/erratic daytime usage patterns at one of their facilities. A look at the major systems of the building revealed that a chiller which had been recently serviced was to blame. Further investigation revealed that during a recent service call the chiller had been severely over-charged with refrigerant. Having a near real-time window into their energy usage enabled the facilities personnel to identify the unusual usage pattern, and proactively remedy a potential chiller issue that could have resulted in thousands of dollars in repair costs and possibly escalated their demand charges had it gone unnoticed.
- Similarly, you may discover unusual, wasteful patterns or aberrations in overall facility energy usage as well as specific areas (e.g., an BAS reset inadvertently switches on all lights in an unoccupied underground parking garage at 2 AM).
- Simplify on-site event planning (e.g., for K-12 schools or colleges) and/or production line scheduling (for manufacturing) with day-ahead pricing and forecasting at your fingertips.
- Quickly and accurately substantiate the impact of your energy efficiency initiatives and sustainability programs (and share results with your team and management).
- Avoid setting a new annual or monthly consumption peak, enabling you to manage demand charges for next year. Click to see more on Peak Demand Management in New England and Texas, for example.
- Immediately evaluate the efficacy of (and fine tune as needed) new load curtailment strategies.
- Further leverage your building automation systems and curtailment planning while minimizing impact on occupants (students, staff, employees, tenants, etc.).
- Facilitate optimized participation in multiple DR programs, including Emergency Capacity, Economic DR, Ancillary Services, and more.
- In addition to monitoring real-time utility load, several customers (i.e. a manufacturer of water valves and a supplier of military components) also view sub-meter data in the CPower App to provide them with a more granular, process-level picture of the energy usage in their facility.
The Bottom line
Real-time metering ultimately increases your DR earnings and savings to fund additional efficiency initiatives, while complementing your facility’s energy conservation and sustainability efforts. There are no out-of-pocket costs, since fees to install hardware, support software provisioning and enable data measurement & verification (M&V) are typically covered by DR program earnings.
By giving you near real-time visibility and analytics of your energy consumption, enhanced metering techniques provide more earnings and savings via greater control over your DR participation and greater awareness of electricity usage patterns (remember kW vs kWh!)
ERCOT DR
CPower can help you earn with ERS and LR and save with 4CP…
Texas Generators
You rely on your backup generator for power when there’s an outage.…
CPower to help reduce electricity demand during peak hours in National Grid’s New England service territory
CPower to help reduce electricity demand during peak hours in National Grid’s New England…
NE Generators
CPower’s team of energy experts can assess your generator and determine if…
New England Demand Response
CPower can help you earn with Real Time Demand Response and…
Program Snapshots
Key information on demand management programs around the country. Learn…