Our Blog On-Demand
Content
Knowledge Hub
Knowledge Hub


According to the U.S. Department of Energy, an estimated 20-50% of industrial energy input is lost as waste heat.
Many industrial organizations in the U.S. have learned how to recover waste heat, yet few understand how to monetize it.
Industrial waste heat is the energy generated in an industrial process that is not put to practical use. Waste heat sources include hot combustion gases discharged to the atmosphere, heated products exiting industrial processes, and heat transfer from hot equipment surfaces.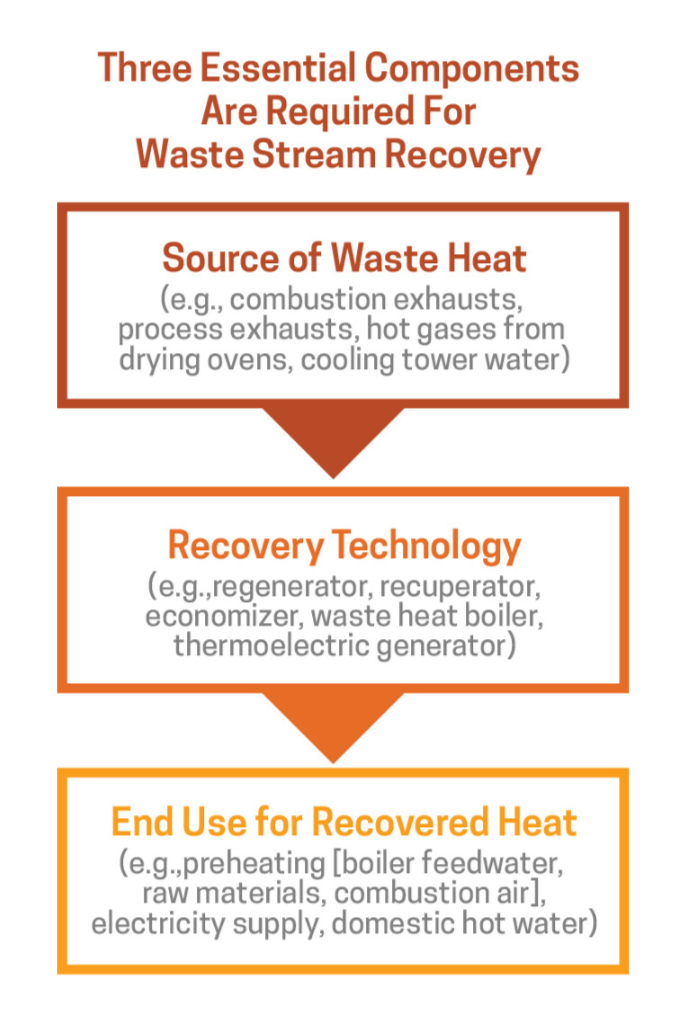
Waste stream recovery involves capturing and reusing waste heat for the purpose of heating or for generating mechanical or electrical work.
Example uses for recovered waste heat include:
Types of industrial manufacturers that are good candidates for waste heat recovery include:
Glass Manufacturing–Regenerators and recuperators are the most frequently used systems for waste heat recovery in the glass industry, which collectively consumes approximately 300 TBtu/year.
Cement Manufacturing–The cement industry consumes about 550 TBtu/year with its most energy-intense processes including those which mine and prepare raw materials for the kiln, clinker, production, and cement milling. Options for heat recovery include preheating meal and power generation (cogeneration).
Iron and Steel Manufacturing–Consuming approximately 1,900 TBtu of energy per year, the U.S. iron and steel industries are prime candidates yet face a challenge for executing economically sound heat recovery. While recovery from clean gaseous streams in these industries is common, heat recovery techniques from dirty gaseous streams (from coke ovens, blast furnaces, basic oxygen furnaces, and electric arc furnaces) often incur high capital investment costs.
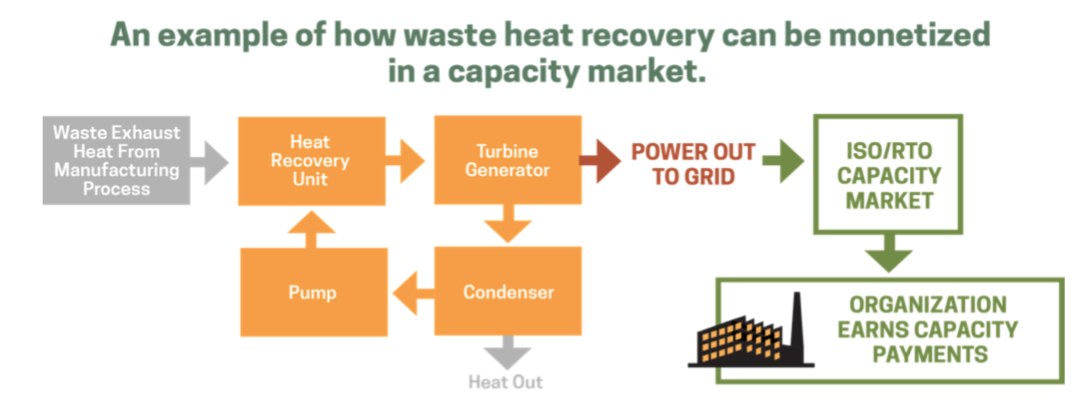
In several deregulated markets in the U.S.–PJM, for example–recovered waste heat can be monetized by offering the recovered resource into the region’s forward capacity market.
Forward capacity markets like PJM’s Reliable Pricing Model (RPM) allow the grid operator to procure the grid’s required capacity in advance of its delivery day.
Implemented in 2007, PJM’s Reliability Pricing Model uses a market approach to obtain the capacity needed to ensure its grid’s reliability.
The RPM’s market approach includes incentives that stimulate investment in existing generation from traditional sources like power plants while encouraging the development of other resources such as demand response and energy efficiency.
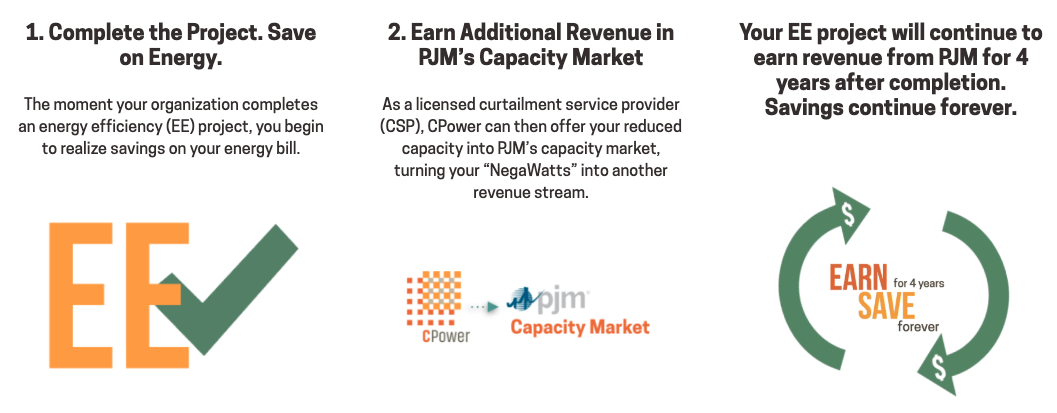
In many cases, organizations that are already participating in waste stream recovery can realize easy earnings akin to found money that requires little work to obtain other than offering the recovered resource into the market.
To learn more about monetizing waste stream recovery and how to offset the rising U.S. energy expenditure share, read CPower’s “Demand-Side Energy Management in the U.S. Manufacturing Industrial Sector: an analysis of revenue-generating strategies.”

Uncertainty is the arch-nemesis of business. In planning for 2020, it appears our old foe has the upper hand
Is 2020 a year for your organization to get aggressive and try to expand? Or is it a year to sit tight and see what happens? Maybe it’s time to pull back on the reins.
Chances are, regardless of your organization’s particular industry, the last two and a half to three years have been especially strong from a growth and productivity standpoint.
After all, 2019 marks the tenth straight year of growth for the U.S. economy, and the U.S. GDP has especially boomed since 2016.
So why, then, is planning for 2020 proving to be harder than in previous years?
The short answer: uncertainty. And this year, our old nemesis is back with a vengeance and flanked by his favorite minions: speculation and conjecture.
No one knows for certain what the future holds. No one knows for sure how long the trade tariffs will last. No one knows who’s going to win the 2020 Presidential election. And no one knows for certain where energy prices might be at this time next year.
And yet here we are, looking for any credible insight we can find that will bring the future into focus so we can make the business decisions today that will position us for success tomorrow.
Rather than guess what tomorrow’s landscape might look like, let us instead look at one key fact established by what already has happened to energy in the U.S.
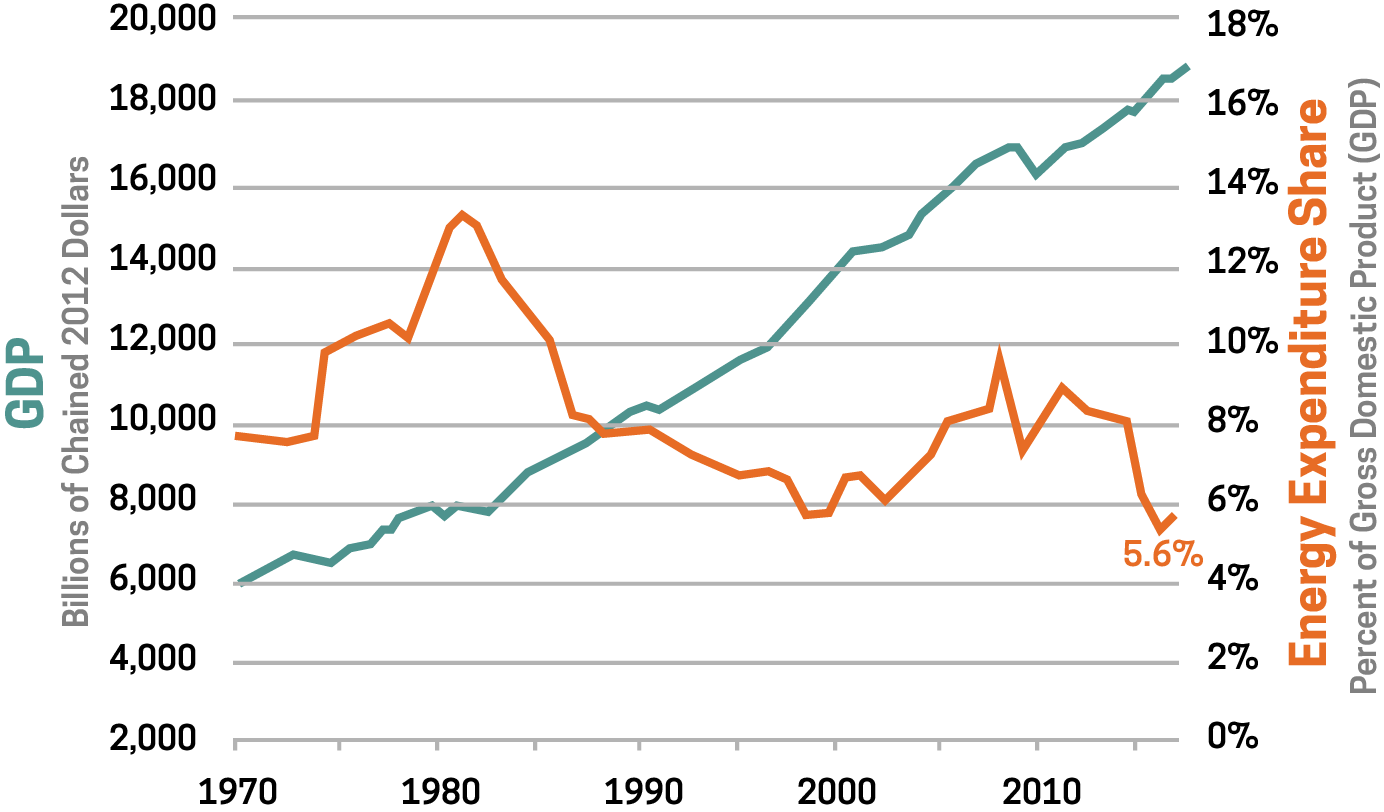
This chart shows the U.S. Gross Domestic Product (GDP) and the US energy expenditure share graphed together over roughly the last 50 years.
The GDP is defined as the total value of goods and services produced in the United States during a specified time.
The U.S. total energy expenditure is defined by the Energy Information Administration (EIA) as the amount of money spent to consume energy in the United States each year.
The energy expenditure share is the total energy expenditure measured as a percentage of the GDP.
Looking at the two graphed together in the chart above, we begin to see a story emerge concerning how well we’ve produced as a country over the last 50 years and how much we’ve spent on energy to achieve that production.
GDP, which does have its down years from time to time, has trended up for just about as long as it’s been measured. The energy expenditure share, on the other hand, has fluctuated wildly over the last half-century.
Consider the 5.6% energy expenditure share that occurred in 2016. That number is significant to everyone in charge of planning for his or her organization’s immediate future.
In 2016, the U.S. energy expenditure share was the lowest it has ever been in the history of the United States of America. Never before had U.S. GDP and energy expenditure share been farther apart than it was just three years ago.
That means, in 2016, the U.S. produced more than we ever had before and spent less on energy as a percentage of that production than at any other time in our country’s history.
The low energy expenditure share isn’t due to a lack of energy consumption in the U.S. The EIA reports the US total energy consumption has remained largely unchanged since 2013.
So why then has our energy expenditure share been so low? The EIA has officially stated the cause is “entirely due to low energy prices,” with abundant, cheap natural gas playing a big role in the overall trend.
Perhaps the better question for businesses to ask is how long is this ideal period going to last?
The short answer is it’s already over.
The EIA has reported that since 2016, average energy prices of motor gasoline, natural gas, and retail electricity have all increased, resulting in higher U.S. energy expenditures in 2017 (5.8%), the last year for which the data is available.
So what’s going to happen to energy prices in 2020? The Energy Information Administration thinks they’ll likely rise. Exactly how much is hard to say.
What this means, however, is that if your organization does everything exactly as it did during the boom of 2016-2017, your results in 2020 won’t be as strong, simply because you’ll have spent more on energy to achieve the same amount of productivity.
There’s an old saying about making hay while the sun shines. When conditions are right for what you do…do it. In the past few years, conditions in the U.S. have never been more right to produce. But those conditions have shifted.
Organizations that understand the nature of that shift as it relates to their energy use and spends are less likely to succumb to uncertainty and the paralysis it can induce when planning for the future.
Optimal productivity is your goal. If uncertainty is the villain standing between your organization and its objectives, then improved demand-side energy management may be the ally you need to help you get to the other side.
To learn more about how to offset the rising U.S. energy expenditure share, read CPower’s “Demand-Side Energy Management in the U.S. Manufacturing Industrial Sector: an analysis of revenue-generating strategies.“


One of the Reforming Energy Vision’s primary goals includes renewable sources generating 70% of the state’s electricity by 2030. To do that, the New York grid seeks to implement distributed energy resources into its fuel mix.
How might New York’s energy market be redesigned to incorporate DERs like solar, energy storage, and others?
NYISO’s proposed changes meet opposition
In 2018, the NYISO proposed changes to the ICAP Capacity Market for how long a resource must be able to run to be eligible to be paid the full value of capacity.
Using the results of a study on energy-limited resources by GE Consulting (GE), the NYISO initially proposed that resources would need to be able to run for 8-hours in order to obtain full capacity value. The NYSIO then proposed it would allow resources that can perform for shorter durations to be paid a fractional portion of the capacity value as follows:
8-hrs=100%
6-hrs = 75%
4-hrs = 50%,
2-hrs =25%
A group of demand response and energy storage providers, including CPower, challenged the GE study’s findings.
A formal review of the GE study by Astrapé Consulting revealed “several flaws in the assumptions and methodology that influenced the study results to show a decreased capacity value for shorter-duration resources than would likely be expected.”
Skepticism of the GE study’s results quickly spread among key New York energy stakeholders, including DR providers, energy storage developers, C&I customers, environmental groups and various trade associations.
These stakeholders submitted a joint letter to the NYISO executive team and board of directors requesting “all market design changes relating to the GE Study results (including any changes to the SCR program) be removed from the DER Roadmap.”
So where does that leave New York?
Potential changes in the New York Energy Market
While there is an ongoing debate about the future of New York’s capacity market, there are no major regulations or market design changes yet announced to take effect in 2019. That could change pending the outcome of an April vote (more than a month away as of this writing) among New York’s energy stakeholders.
That means, for example, the Special Case Resource (SCR) demand response program will continue to operate under its current parameters, including a four-hour duration requirement.
As far as the DER wholesale market goes, New York is in wait-and-see mode. DERs, especially battery storage, and renewable energy sources are a key component of the REV’s drive toward New York’s energy future.
New York, like several other US energy markets, is faced with the question of how to value distributed energy resources in its marketplace.
The question of DER valuation is being debated by the NYISO and various energy stakeholders in the state. As of this writing, there is no definitive timetable for when the debate will conclude and regulations for DER valuation will be enacted.
Energy Storage
New York has taken its place alongside California, New Jersey, and Massachusetts as a first-mover in establishing energy storage targets.
In June 2018, Governor Cuomo announced an energy storage roadmap that set New York’s storage target for 1,500 MW by 2025. According to the roadmap, that ambitious goal could elevate to 3,000 MW by 2030.
At the state level, New York has recognized the need to fund storage projects instead of subsidizing them. Last June, Governor Cuomo committed $200 million from the New York Green Bank to fund storage investments that will help integrate renewable energy onto New York’s grid.
Funding opportunities for storage abound with plenty of state money being made available for storage development.
But without certainty on the wholesale market side and established rules concerning dual participation between markets, meeting the state’s ambitious storage goals will continue to have its challenges.
The key energy players in New York will need to resolve these issues before any substantial investment from the private sector will take a position on energy storage. The NYISO is targeting April 17, 2019, for a vote on market design to accommodate DER integration into its wholesale markets.
This post was excerpted from the 2019 State of Demand-Side Energy Management in North America, a market-by-market analysis of the issues and trends the experts at CPower feel organizations like yours need to know to make better decisions about your energy use and spend.
CPower has taken the pain out of painstaking detail, leaving a comprehensive but easy-to-understand bed of insights and ideas to help you make sense of demand-side energy’s quickly-evolving landscape.

When it comes to capacity prices in New York state, the story changes depending on the geographic region.
Capacity prices are historically low right now in upstate New York but increase through the Lower Hudson Valley toward New York City, due to transmission constraints.
The announced retirement of Indian Point nuclear facility scheduled for 2020 and 2021 leaves New York with 2,000 MW to be replaced just outside of New York City.
NYISO points to new natural gas generation and other renewable generation scheduled to come online as reasons for Indian Point’s retirement. Still, capacity prices in New York City heading into Summer 2019 are comparatively high compared with the rest of the state.
Where there are high capacity prices, there are opportunities to earn revenue for wisely using energy.
Many of these opportunities exist at both the utility and NYISO level.
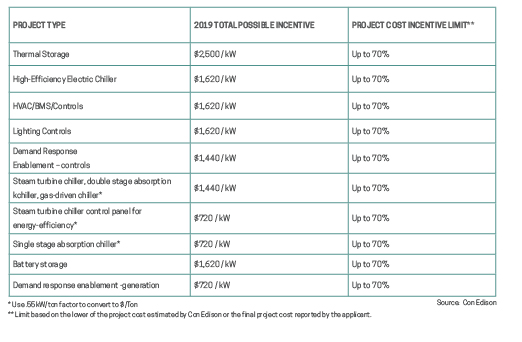
Con Ed’s Demand Management Program (DMP)
Con Ed provides financial incentives for organizations that help the grid lower its peak demand on New York’s hottest days.
The DMP is a rebate-based program that rewards Con Edison and New York Power Authority (NYPA) customers in New York City and Westchester for installing energy-saving technologies, thereby permanently reducing their overall demand.
Eligible projects include:
Demand Response in New York
In 2016, several New York Utilities began offering two new demand response programs in conjunction with the REV:
ConEd has been offering CSRP and DLRP since 2009/2010. The programs will continue to run in 2019.
NYISO’s Special Case Resource (SCR) program, the longest running demand response program in NY, will also run in 2019 along with NYISO’s economic programs: the Day-Ahead Demand Response Program (DADRP) and the Demand-Side Ancillary Services Program (DSASP)
Currently, there are 17 demand response programs being offered to commercial and Industrial organizations in New York. That number may change in 2019/20 as several New York Utilities consider removing DLRP or CSRP.
Natural Gas Demand Response
Con Ed is poised to continue leading New York utilities’ push for demand response.
Building on its 20-year experience administering DR programs, the utility is exploring ways to use natural gas demand response as a “non-pipe solution” to alleviate potential grid stress brought on by growing natural gas demand and pipeline constraints into New York City.
Con Ed’s natural gas DR program is currently in pilot phase. If successful, expect other New York utilities adopt it into similar programs of their own where gas pipeline constraints exist.
Non-Wires Solutions
Non-wires solutions (NWS) are investments in the electric utility system that can defer or replace altogether the need for specific transmission and/or distribution projects.
NWS help to provide a cost-effective reduction of transmission congestion or distribution system constraints at times of peak demand.
New York is looking to implement several non-wires solutions, including fast-acting demand response with dispatch notices as short as five minutes and curtailment durations that last as long as 12 hours.
Organizations wishing to participate in such programs will likely need to accommodate the short dispatch notice with technology that facilitates automated DR.
This post was excerpted from the 2019 State of Demand-Side Energy Management in North America, a market-by-market analysis of the issues and trends the experts at CPower feel organizations like yours need to know to make better decisions about your energy use and spend.
CPower has taken the pain out of painstaking detail, leaving a comprehensive but easy-to-understand bed of insights and ideas to help you make sense of demand-side energy’s quickly-evolving landscape.

In the near future, organizations with flexible resources at their disposal will have an advantage when it comes to earning money for helping the grid.
California is committed to integrating renewables into its electrical grid. The load-shift product is set to launch in November 2019. In its wake, expect a series of flexible resource products to be proposed, reviewed, and eventually launched.
The next generation load shift product and any subsequent flexible resource products will likely be technology-neutral, meaning customer loads will be able to participate as long as customers can curtail on-demand and respond to short-term curtailment windows.
When it comes to demand-side energy planning, California’s legislative arm is forward-thinking, investing in the infrastructure and systems needed to reach the state’s ambitious goals.
For now, commercial and industrial customers are a different story.
Many organizations simply have not yet made the kind of investments in specialized equipment or automation needed to optimize their participation in the kind of programs California is looking to introduce.
Whether or not to embark on a system upgrade is a cost/benefit analysis large California organizations would be wise to consider.
In the very near future, there is going to be a potentially significant earning opportunity for organizations that can quickly dispatch flexible resources when the grid is stressed or market prices are exceedingly high.
Organizations that are open to automation and have made the right investments their systems are going to be the ones capable of performing and will reap the rewards for keeping the California grid reliable.
This post was excerpted from the 2019 State of Demand-Side Energy Management in North America, a market-by-market analysis of the issues and trends the experts at CPower feel organizations like yours need to know to make better decisions about your energy use and spend.
CPower has taken the pain out of painstaking detail, leaving a comprehensive but easy-to-understand bed of insights and ideas to help you make sense of demand-side energy’s quickly-evolving landscape.

California experiences a daily spike in energy demand in the early evening when renewable sources like solar go offline and residents come home from work and increase their energy consumption by flipping on their air conditioning, turning on their lighting, doing laundry, charging electronic devices, and engaging in other energy-consuming activities.
When charted on a graph (see picture), the shape of California’s daily electrical consumption resembles a duck. Analysts have noted the duck’s belly is getting fatter with each passing year, meaning the evening net load ramp when flexible resources are needed to account for the spike is becoming more extreme.
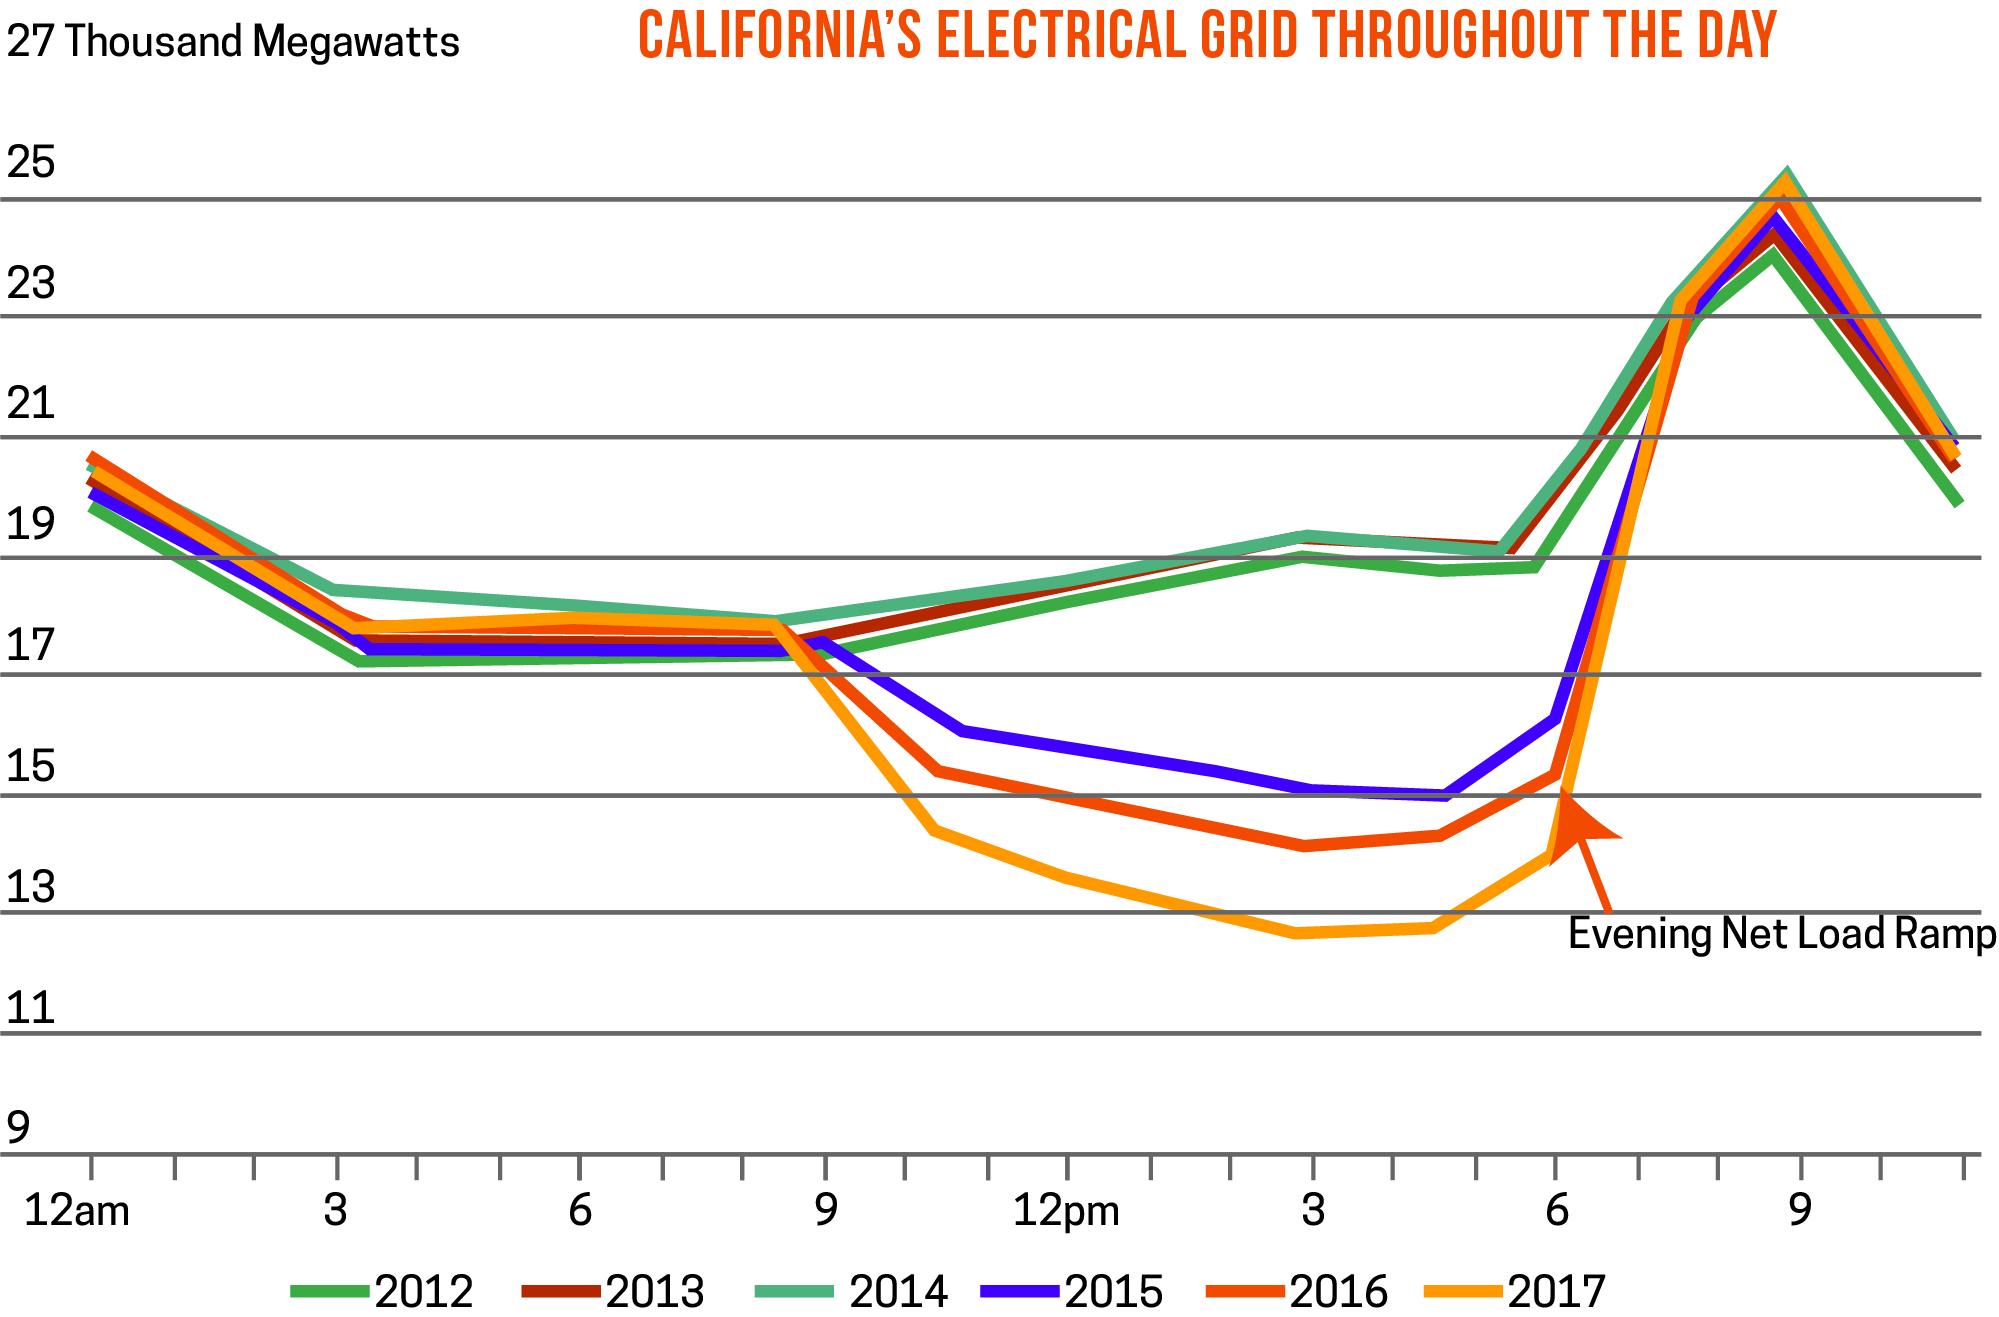
A Steady Diet of Storage
The duck’s belly may not get fatter in 2019, but it’s still going to be heavy.
To help alleviate grid stress associated with evening load ramp, CAISO is developing a load-shifting product under the third phase of CAISO’s Energy Storage Distributed Energy Resource (ESDER) that would be the state’s first product that will pay a resource to consume energy to soak up excess generation during negative pricing periods.
CAISO’s load-shift program embodies California’s desire to bring clean resources to the forefront of grid reliability by storing excess clean energy and making it available for future use.
The program, championed by the California Energy Storage Alliance (CESA) among other energy storage companies, also aims to reduce the number of solar curtailments needed to offset the ill effects of negative pricing caused by a large solar surplus on CAISO’s system.
The two big questions on the minds of organizations that have implemented or are thinking of implementing energy storage are:
The short answer to the first question is the program is currently going through the FERC approval process and is scheduled to go into effect in November 2020.
As far as how storage will be valued in the wholesale market? It’s too early to tell right now, but expect California to continue to work to provide value for all the services storage can provide.
This post was excerpted from the 2019 State of Demand-Side Energy Management in North America, a market-by-market analysis of the issues and trends the experts at CPower feel organizations like yours need to know to make better decisions about your energy use and spend.
CPower has taken the pain out of painstaking detail, leaving a comprehensive but easy-to-understand bed of insights and ideas to help you make sense of demand-side energy’s quickly-evolving landscape.